Everything your IT team needs, in one platform.
Xentrio covers the full IT service management lifecycle, from helpdesk tickets and infrastructure monitoring to endpoint control, security posture scanning, and Microsoft 365 cost optimization. Available in English, Spanish, and French.
Ticket Management
Full-lifecycle helpdesk with ITIL Impact × Urgency priority matrix, SLA escalation rules, ticket merging, bulk operations, and Microsoft Teams Adaptive Card notifications.
- ⏱SLA escalation rules — Auto-notify managers and/or reassign to a team N minutes before breach; configurable per priority
- 💬Teams notifications — Adaptive Card to configured channel on ticket created and ticket closed
- 🔀Ticket merging — Consolidate duplicates; merged tickets closed and linked to the primary
- ☑️Bulk operations — Bulk assign (technician or team) and bulk status change across selected tickets
- 📎File attachments — Internal notes, customer-visible comments, and Azure Blob attachments per ticket
- 🌐Client portal — End users submit and track their own tickets without a technician login
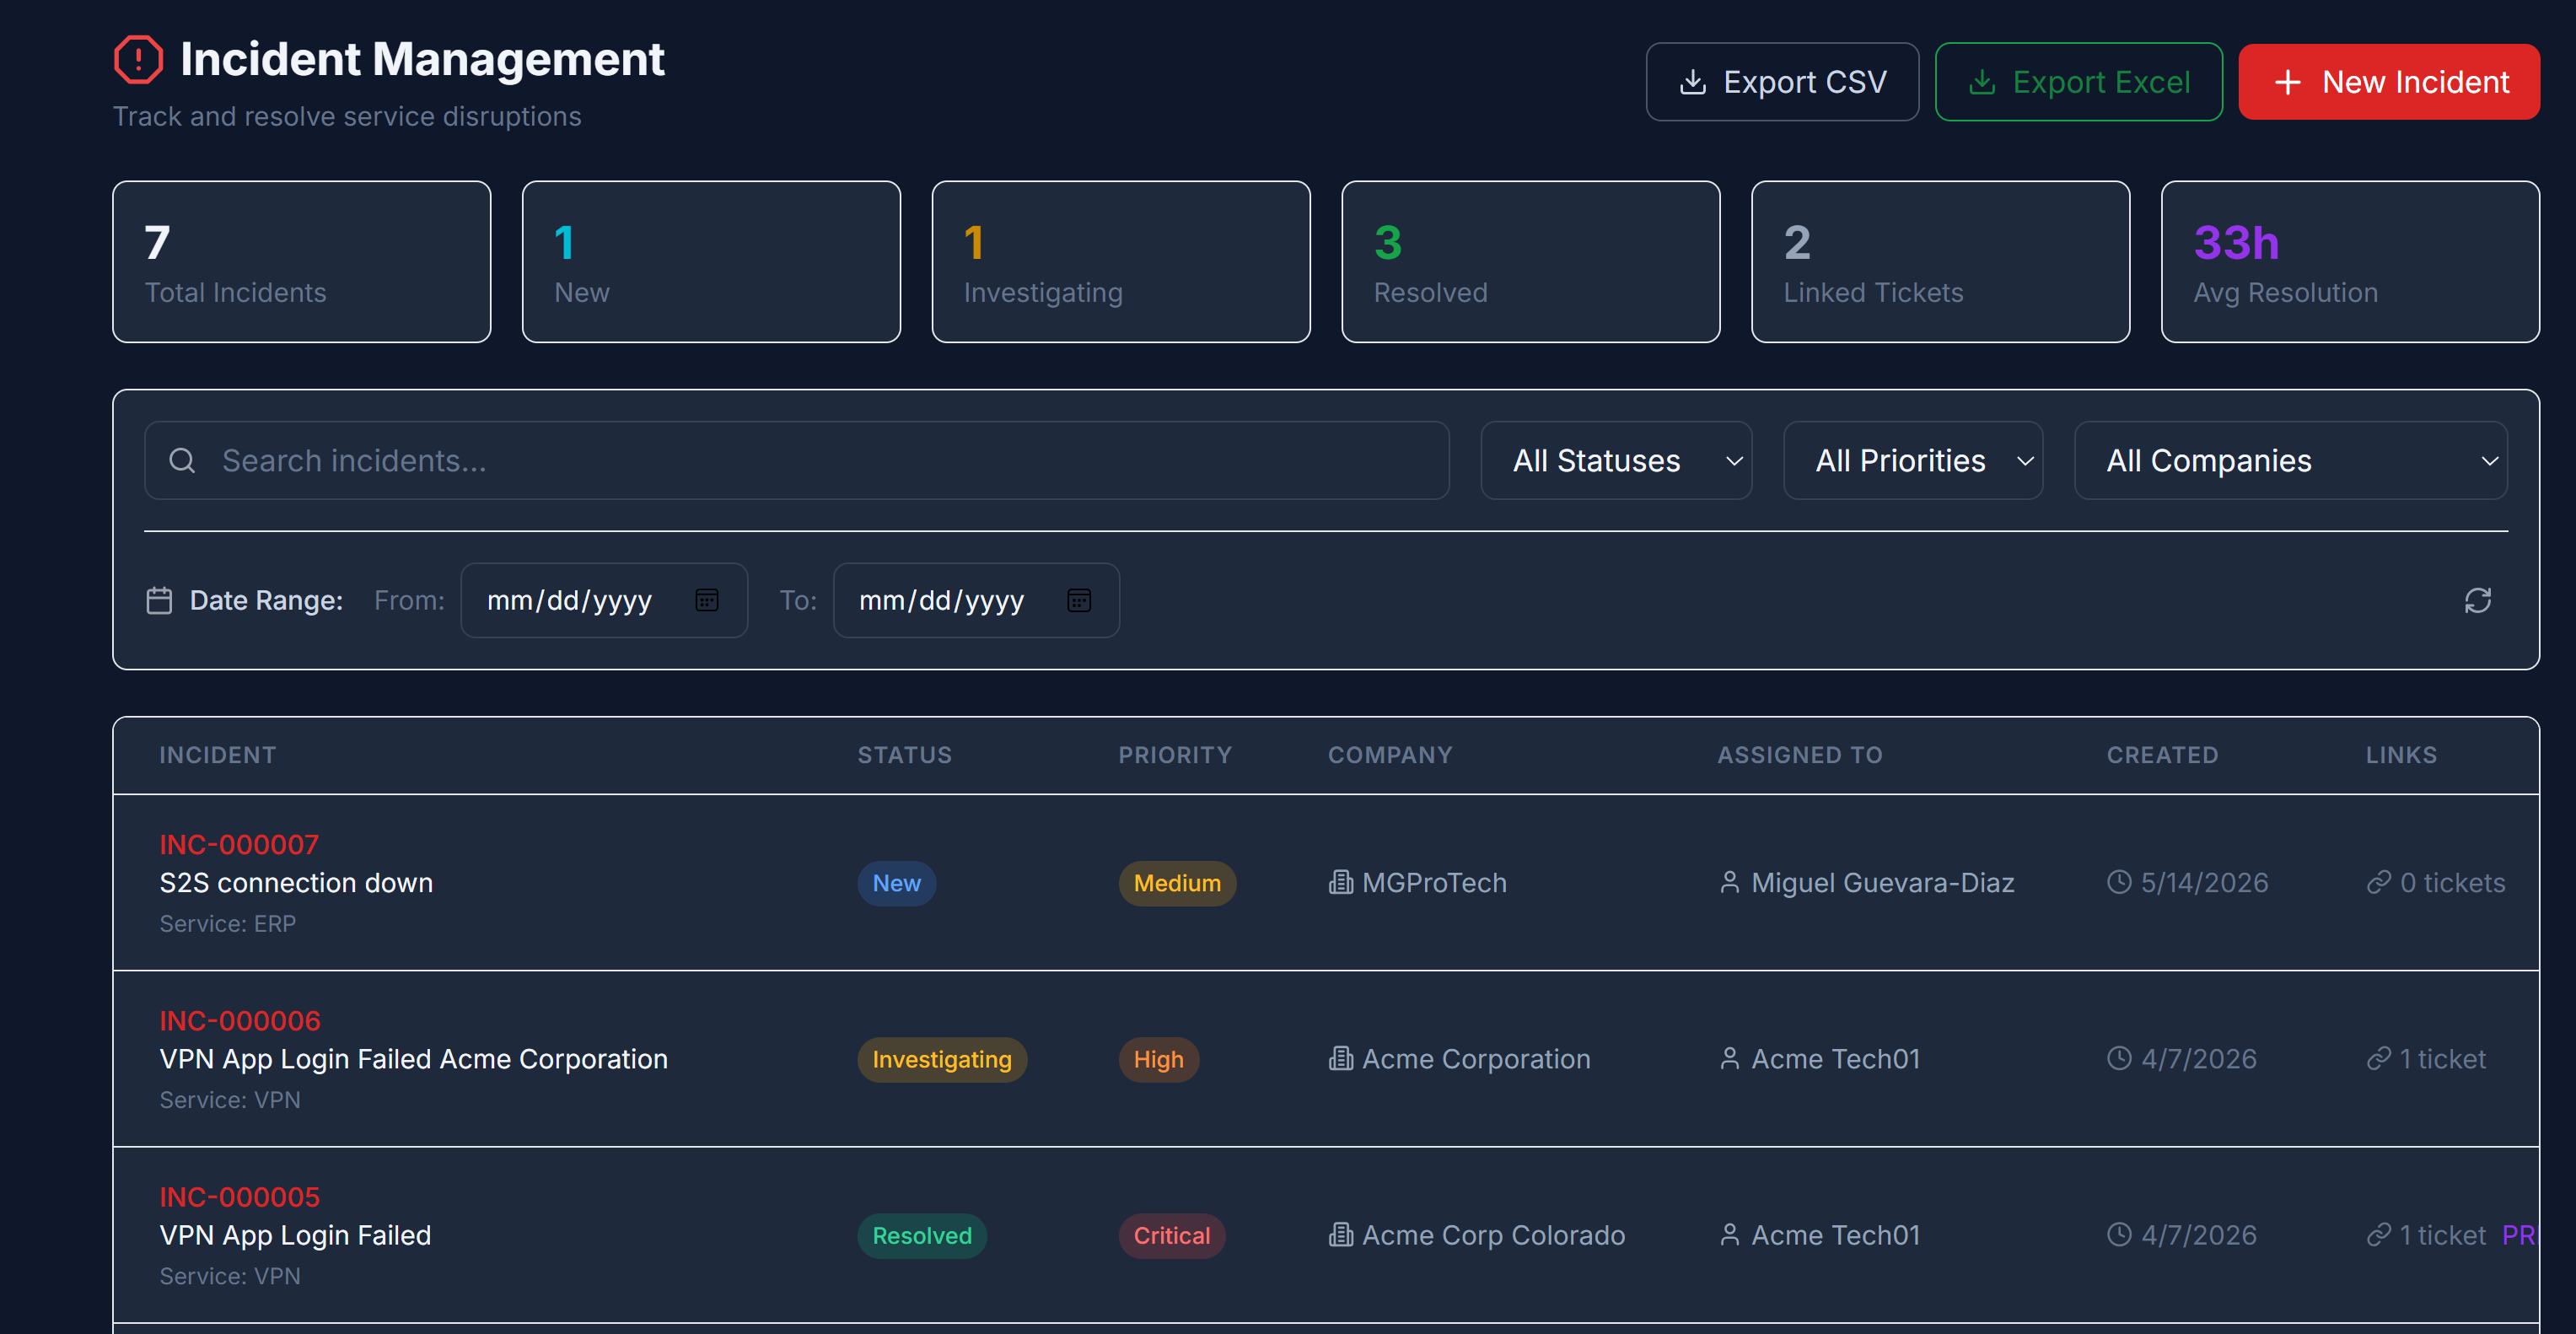
Incident Management
Coordinate and resolve major IT incidents. Link related tickets to a single incident, classify by impact and urgency, and track full resolution history.
- 🔗Ticket rollup — Link multiple tickets to one incident for unified tracking
- ⚡Escalation paths — Severity classification drives automated escalation routing
- 📊MTTR tracking — Mean time to resolution calculated per incident and team
- 📋ITIL-aligned workflow — Detect → Assign → Investigate → Resolve → Post-mortem
- 🕓Full history — Every state change, note, and resolution step recorded
- 💬Teams notifications — Adaptive Card to configured channel on incident opened and incident resolved
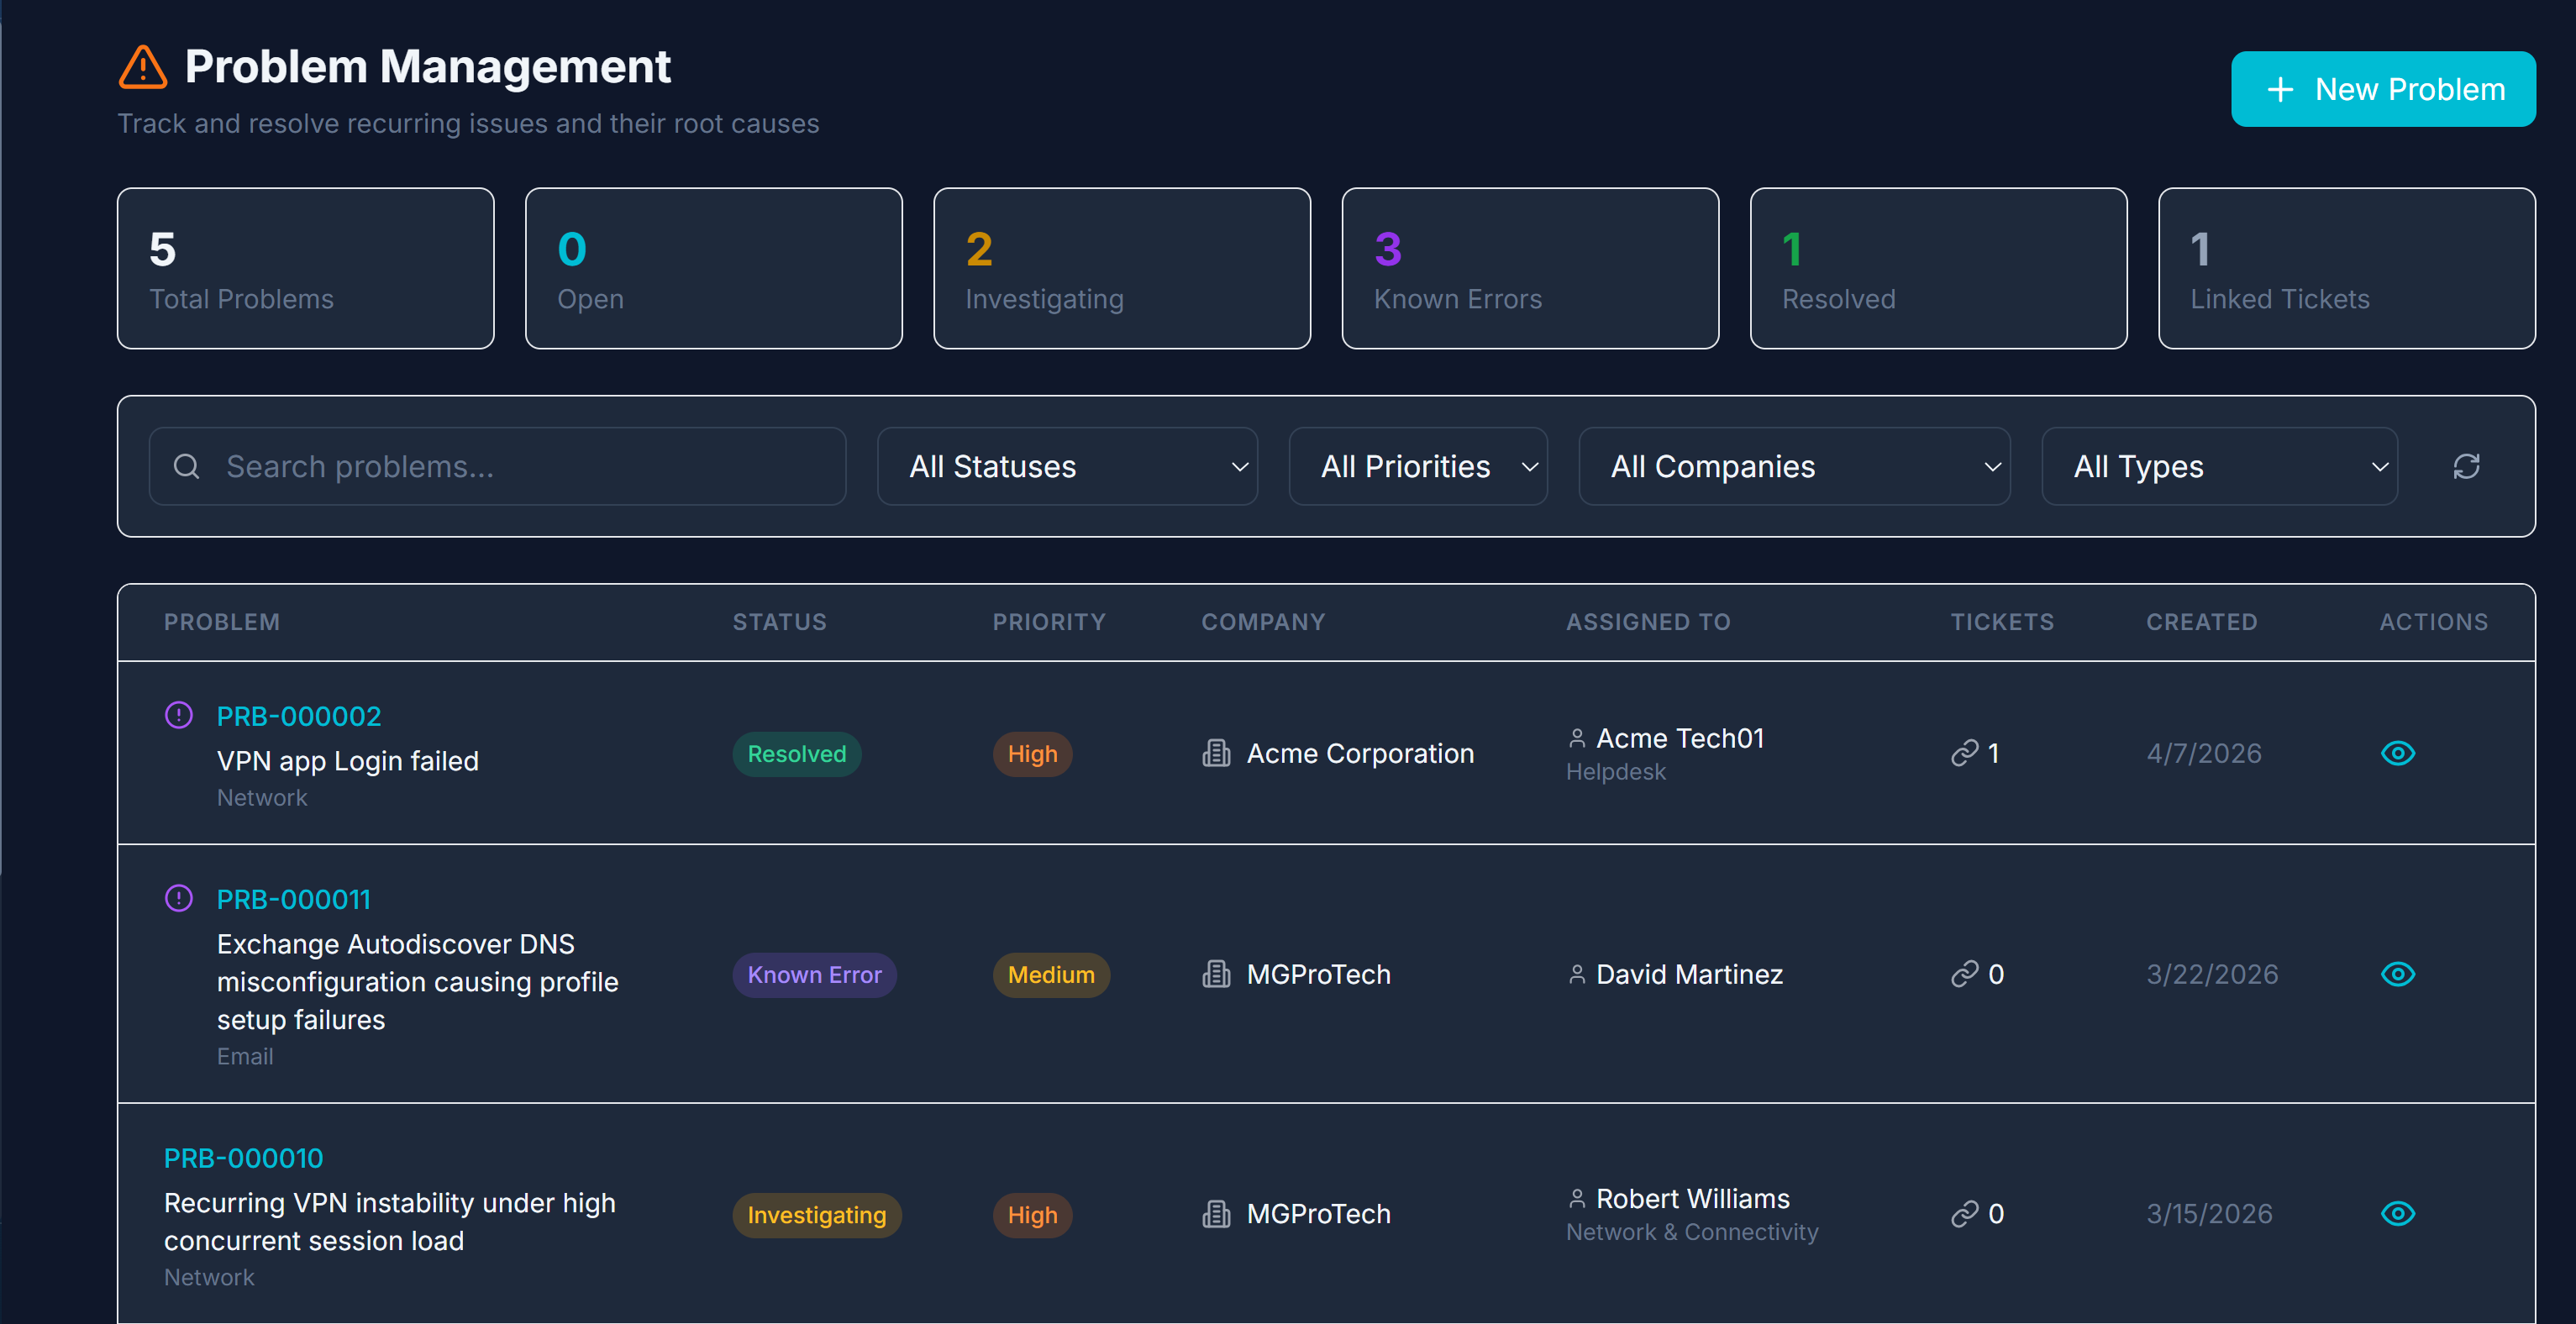
Problem Management
Root cause analysis and permanent fix tracking. Link problems to recurring incidents, document known errors, and prevent issues from reoccurring.
- 🔗Incident linking — Problems reference all related incidents for pattern analysis
- 📖Known error database — Publish workarounds so technicians can resolve faster
- 🔄RFC spawning — Create a change request directly from a problem record
- 📋Audit trail — Full history of every RCA update and status transition
- 🔁Recurrence prevention — Track reoccurrence after resolution to validate the fix
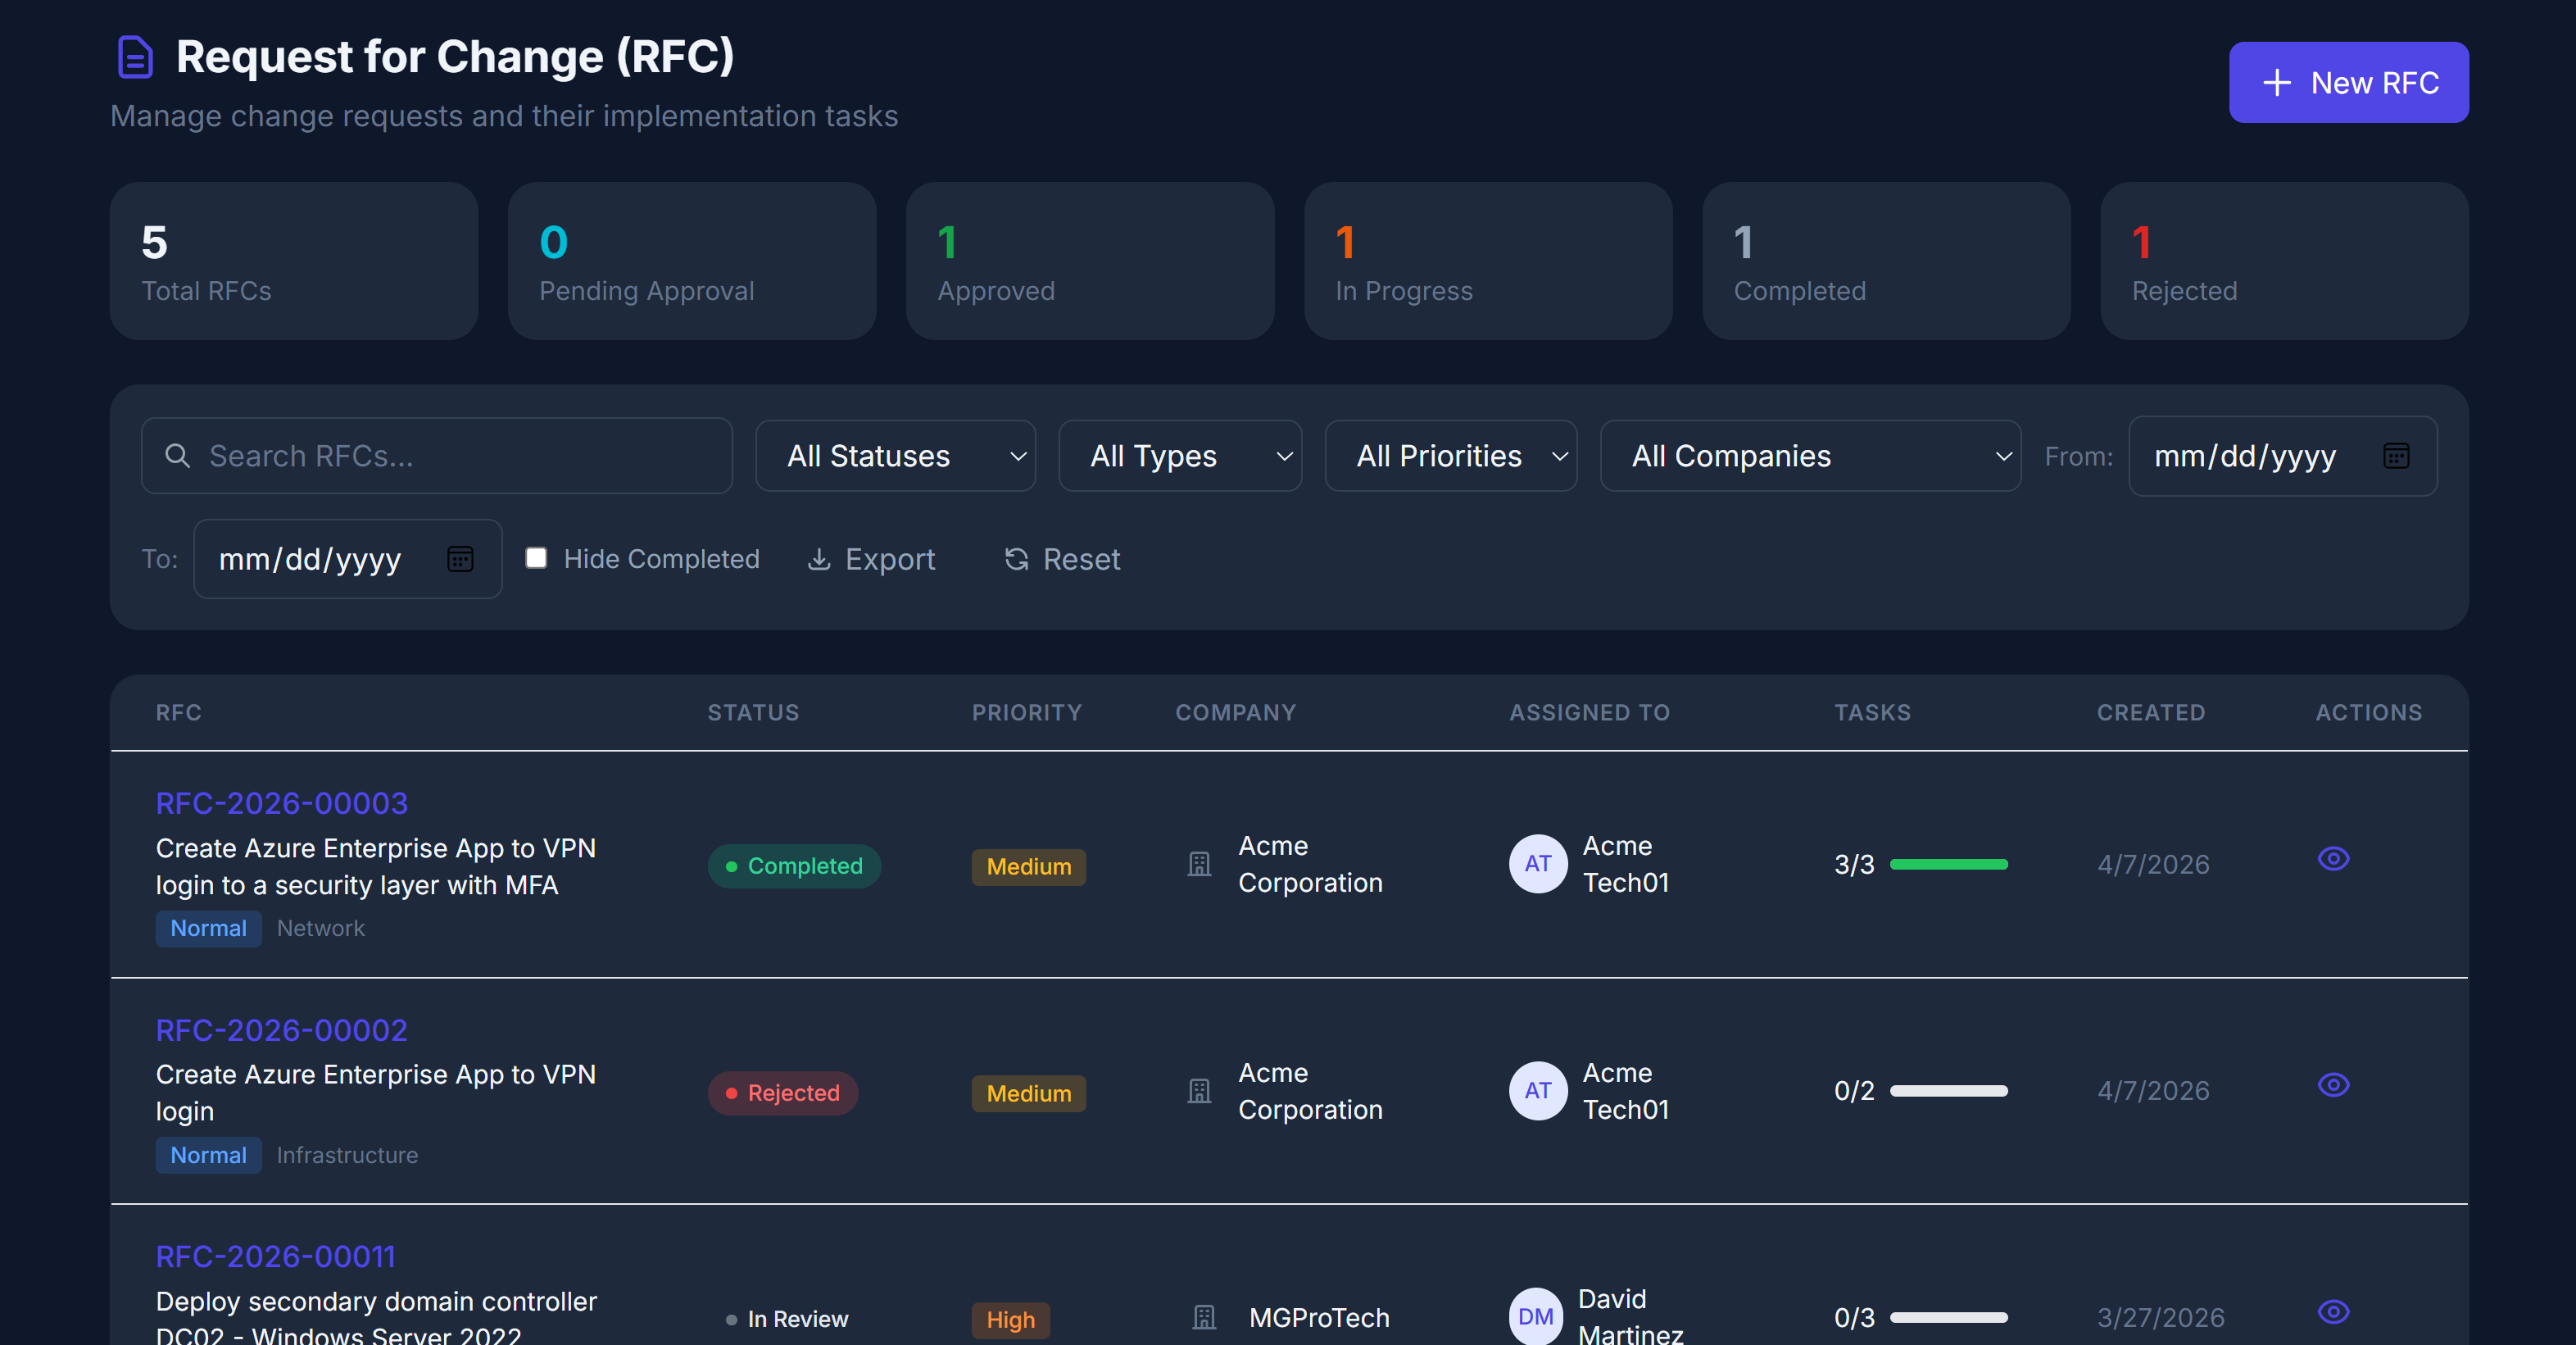
Request for Change (RFC)
Structured change workflow with impact analysis, rollback procedures, task decomposition, implementation scheduling, and full change history.
- ✅Approval workflow — Manager/TeamLead sign-off with full audit trail
- 📋Change tasks — Decompose into subtasks with assignees and due dates
- ↩Rollback procedures — Documented rollback plan required before scheduling
- 🏛CAB process — Change Advisory Board review for major and emergency changes
- 📅Implementation scheduling — Planned start/end window with conflict detection
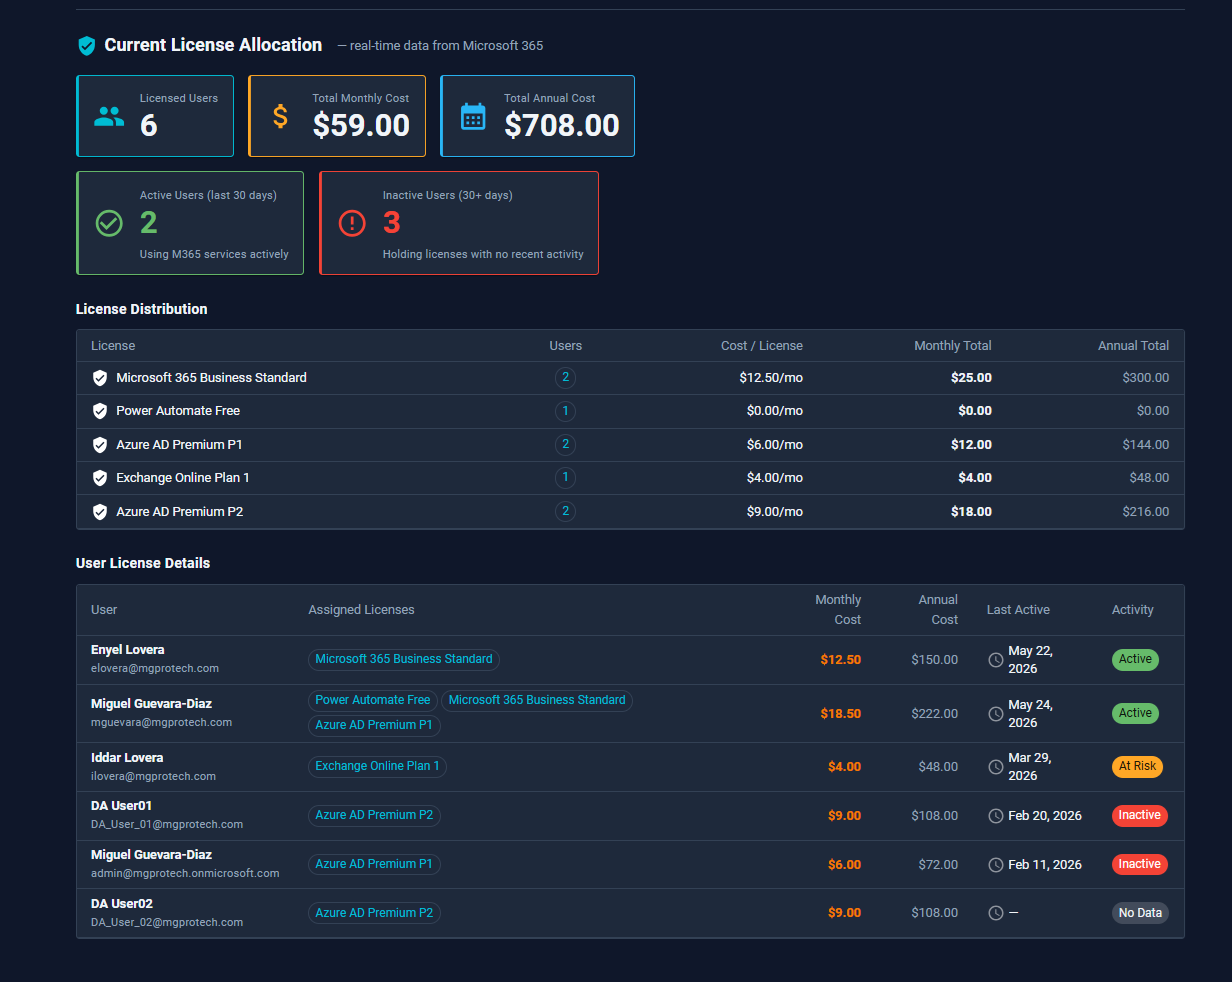
License Advisor
Detect inactive users, surface optimization opportunities, and project monthly savings using live Microsoft Graph data across 55+ mapped license SKUs.
- 📊Monthly savings projection — Estimated cost reduction based on optimization opportunities
- 🔴Live Graph data — Real-time M365 license data from each company's Microsoft tenant
- 🏷55+ SKUs mapped — Business Basic, Business Premium, E3, E5, and all add-ons decoded
- 👤Per-user activity — Last sign-in, assigned licenses, and recommended action per user
- 🔒Per-company isolation — Each company's Graph data stays scoped to their App Registration
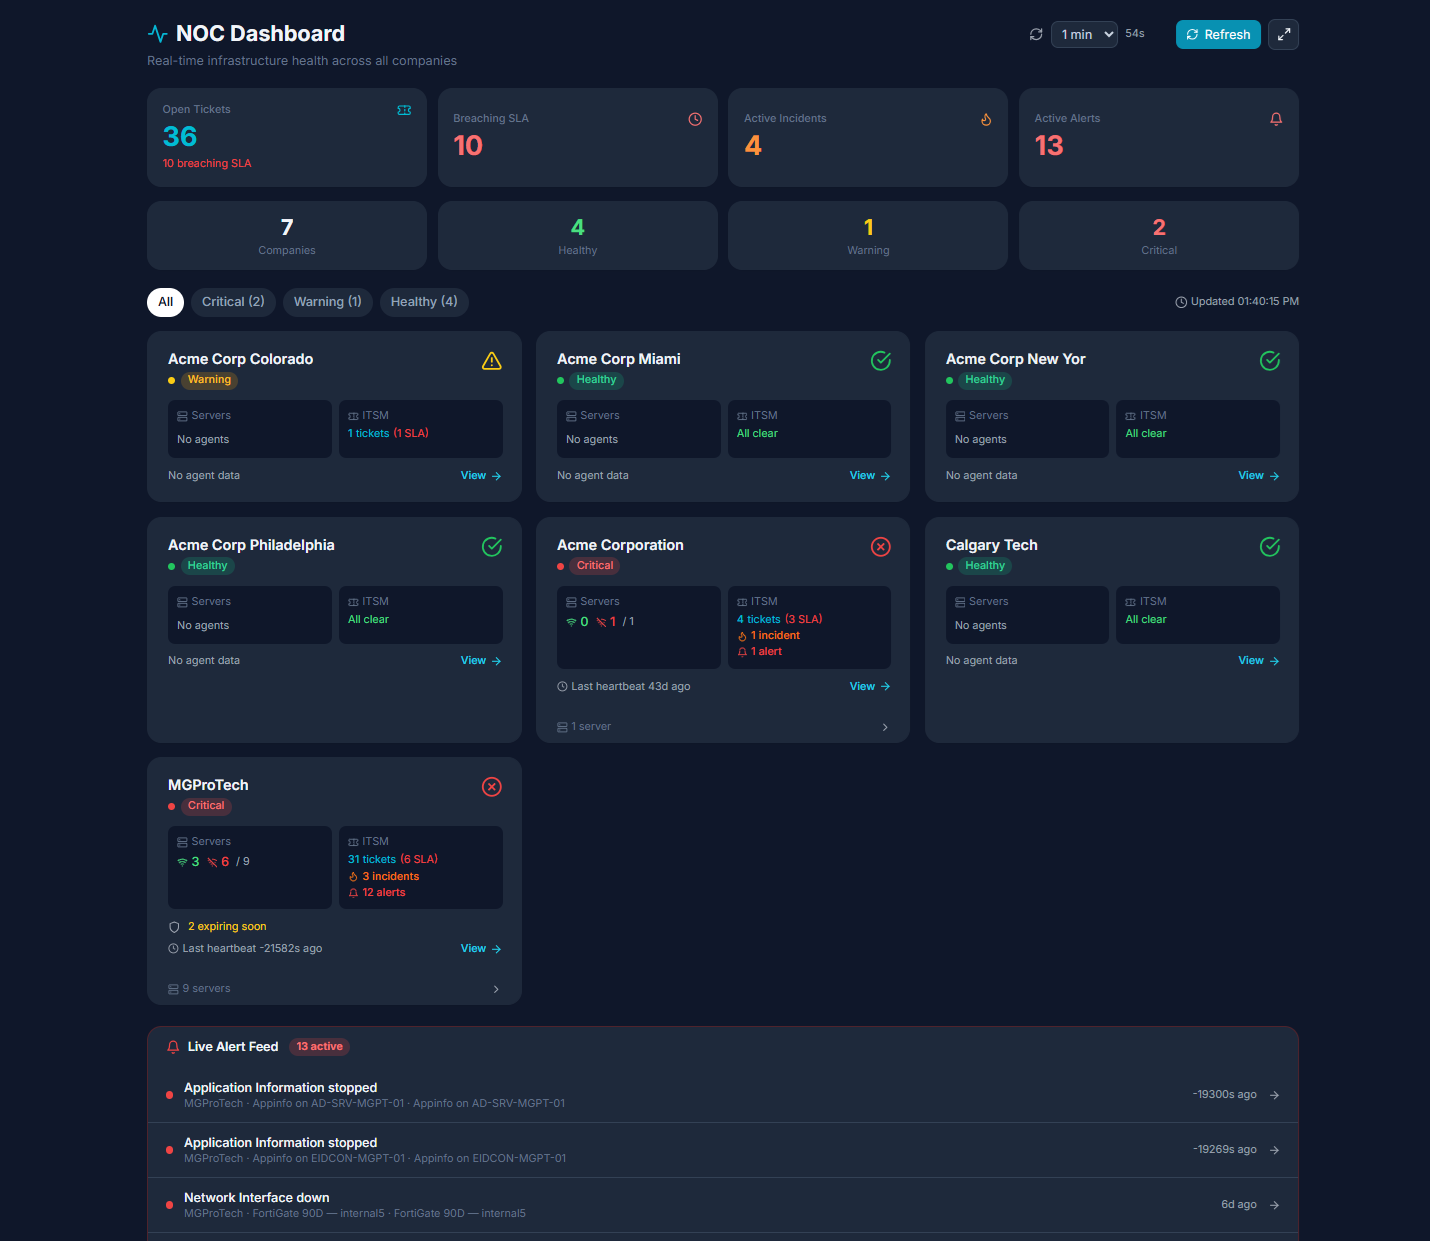
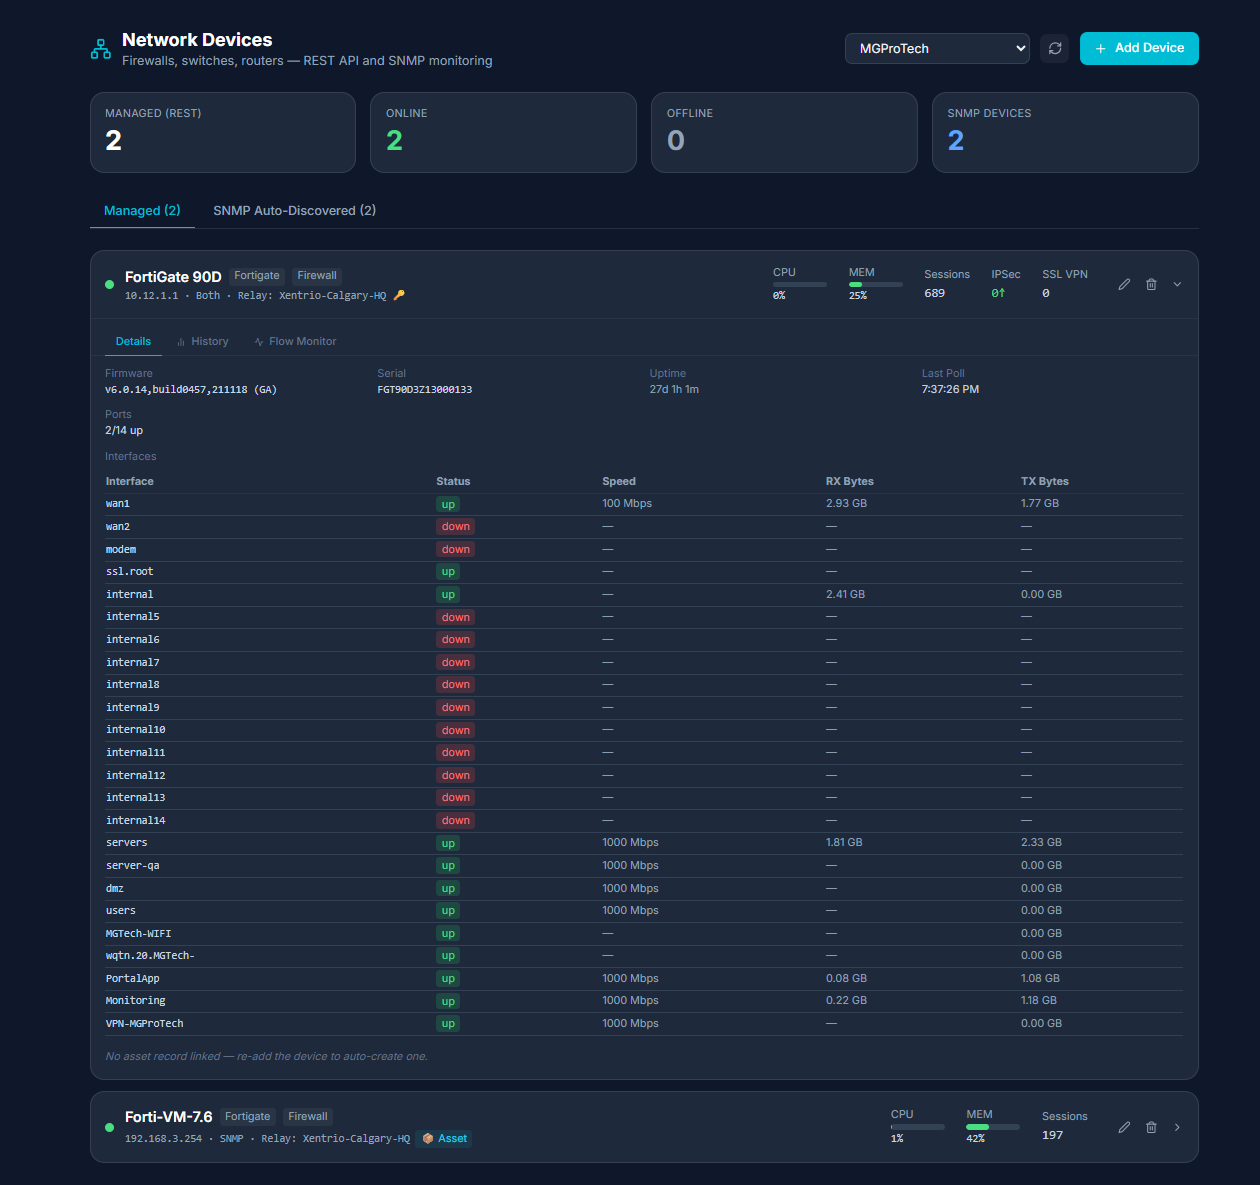
Unified Monitoring
Azure alerts, local server metrics via agent, SNMP network device polling (Cisco, Fortinet, generic), and NOC dashboard — all in one view.
- 📺NOC dashboard — Real-time fleet overview with availability donuts and performance charts
- 📈Sparklines — Inline 24h trend mini-charts in server and device grids
- 🕓Metric history — Raw snapshots 30d, hourly aggregates 6 months; windows from 1h to 90d
- ⚡Availability tracking — Uptime %, longest outage, last-down timestamp per server
- 🔌FortiGate REST API — Sessions, VPN tunnels, HA status, firmware — dual v6/v7 format support
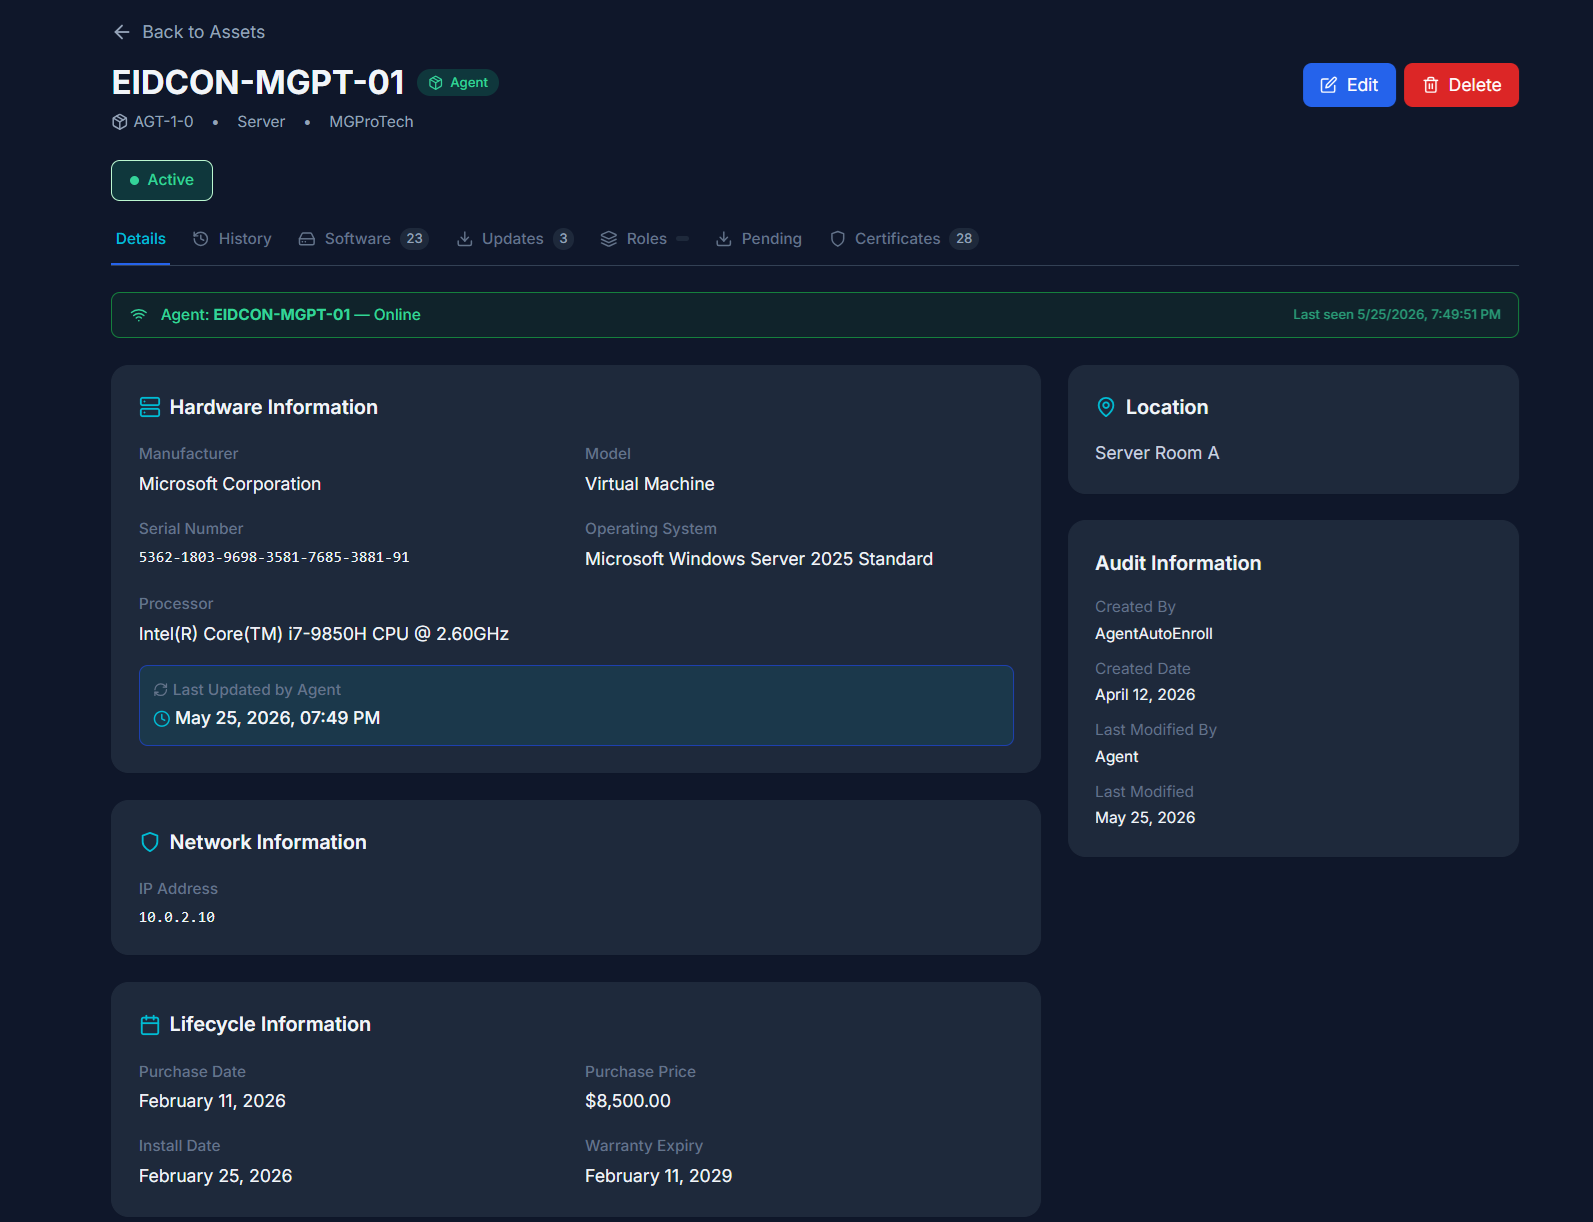
Asset Management
Track VMs, servers, workstations, and custom asset types. Includes Azure VM auto-discovery, Arc server sync, bulk CSV import, and full audit trail.
- ☁Azure auto-discovery — Sync VMs and Arc servers from customer's Azure subscription on schedule
- 📋CSV bulk import — Import asset records with full field mapping
- 🔄Pending updates — Windows/Linux update list with KB article links per server
- 🏷Custom tags — Tag any asset and filter across the entire inventory
- 🔗Linked to monitoring — Assets tied to monitored servers via FK for live health data
- 📋M365 License Sync — Sync Microsoft 365 license assignments into inventory on a configurable schedule
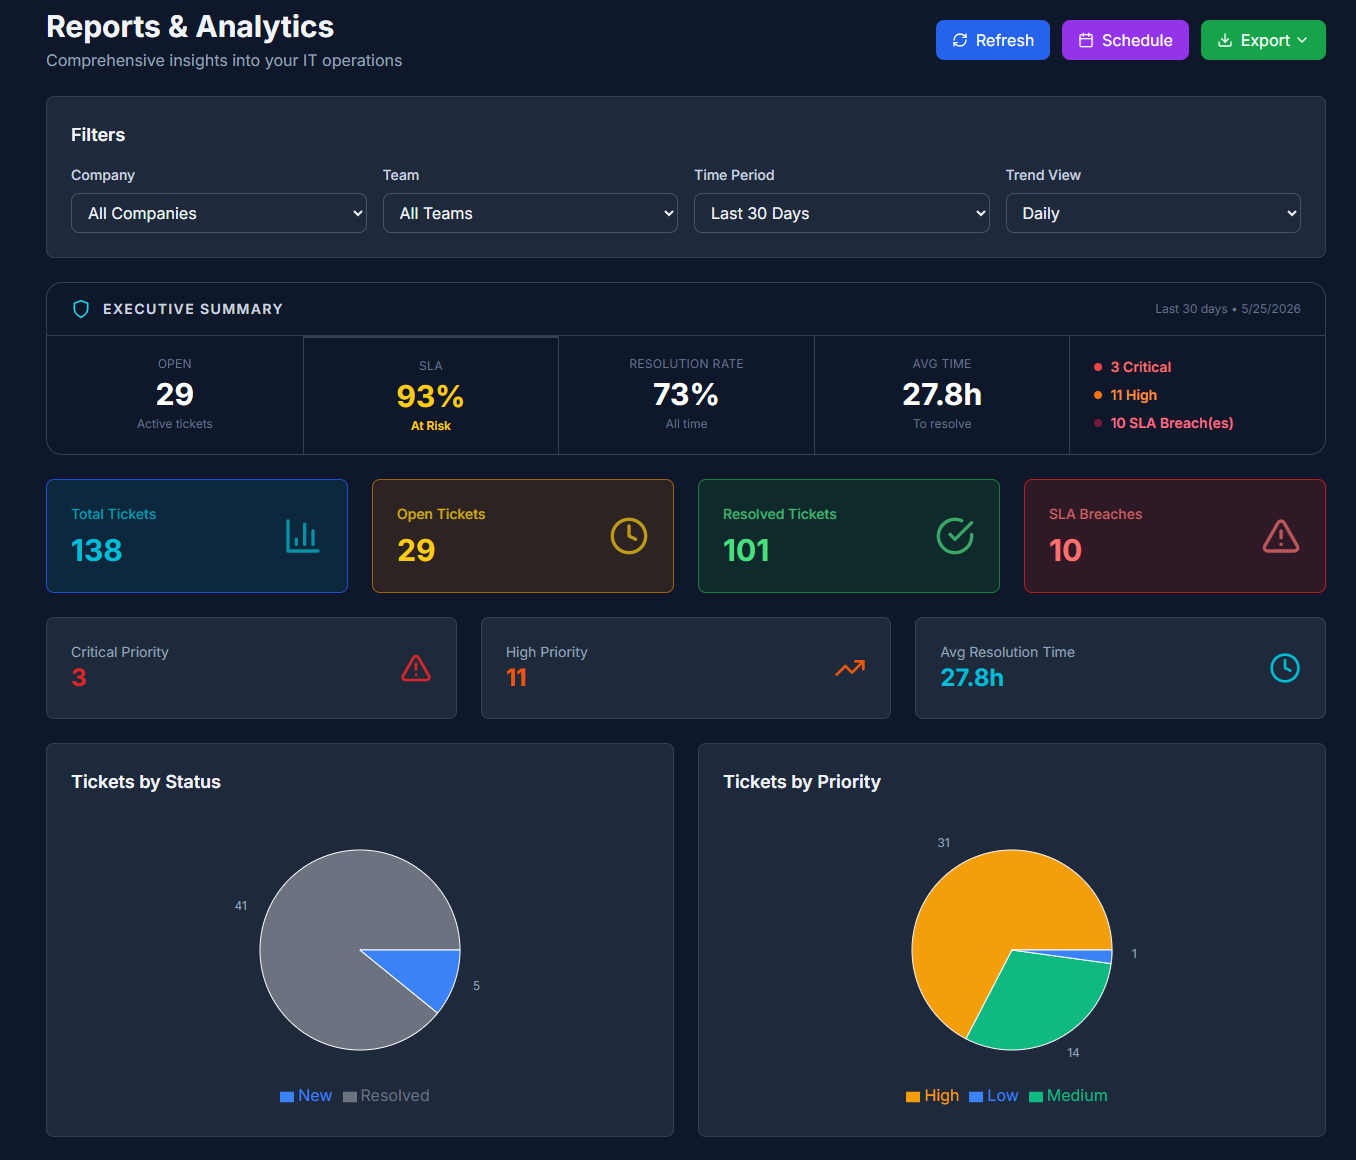
Reporting & Analytics
Schema-driven self-service report builder with 17+ data sources, live preview, and multi-format export — covering ITSM, identity, security assessments, assets, and monitoring history.
- 🛠Self-service report builder — Column picker, filters, date presets, sort — no SQL required
- 📤Multi-format export — CSV, Excel (multi-sheet), PDF (flowing multi-section via QuestPDF)
- 📈Trend charts — Line charts per metric for time-series monitoring history
- 💾Saved templates — Name, describe, and share report configs across the company
- 🔀Cross-source combine — Merge any mix of data sources into a single export
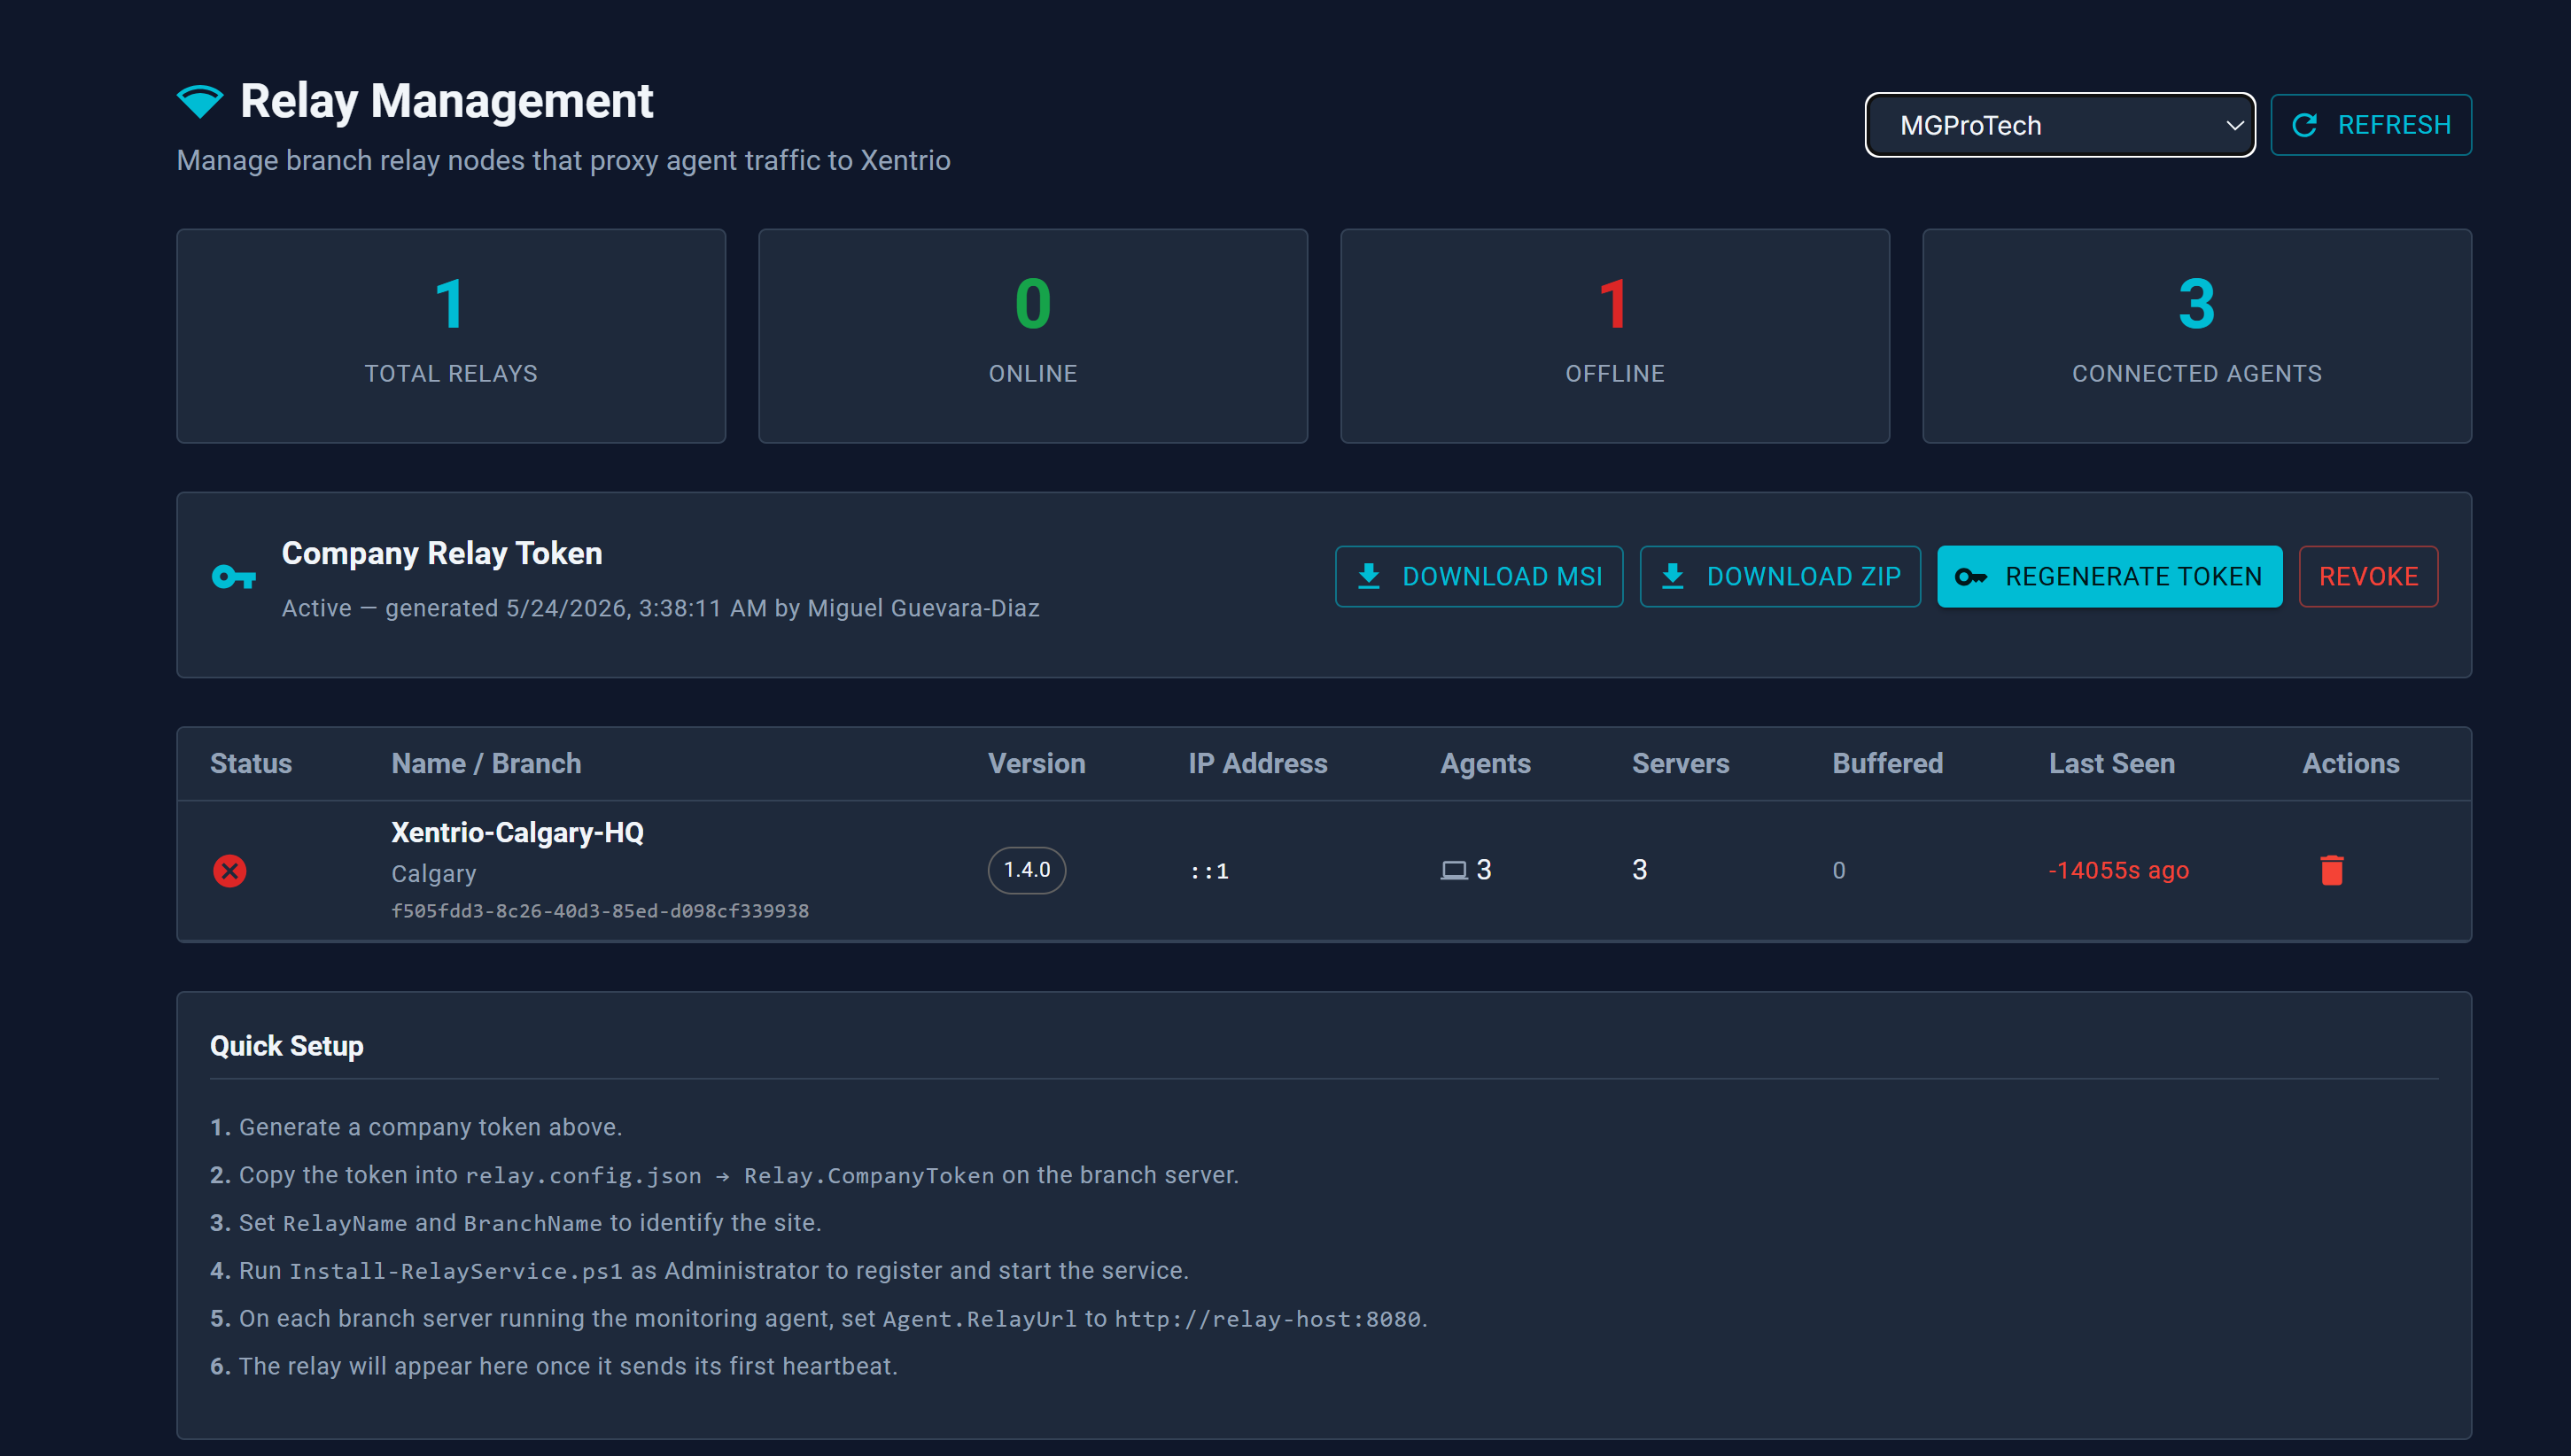
Xentrio Relay
On-site Windows Service that bridges customer LAN to the portal over HTTPS — proxying SSH and RDP sessions, buffering agent data, distributing software packages, and polling SNMP devices. Active/Passive HA with auto-promotion.
- 📦Local software CDN — Caches deployment packages up to 10 GB — no re-download per server
- 📶Offline buffer — Queues agent payloads and flushes when connectivity restores
- ⚙Zero manual config — Device configs pushed from portal via heartbeat response
- 🖥Local dashboard — PIN-protected status UI on port 8081 for on-site diagnostics
- ✅Code signed — EXE + MSI signed with Azure Trusted Signing, CN=MGProTech Inc.
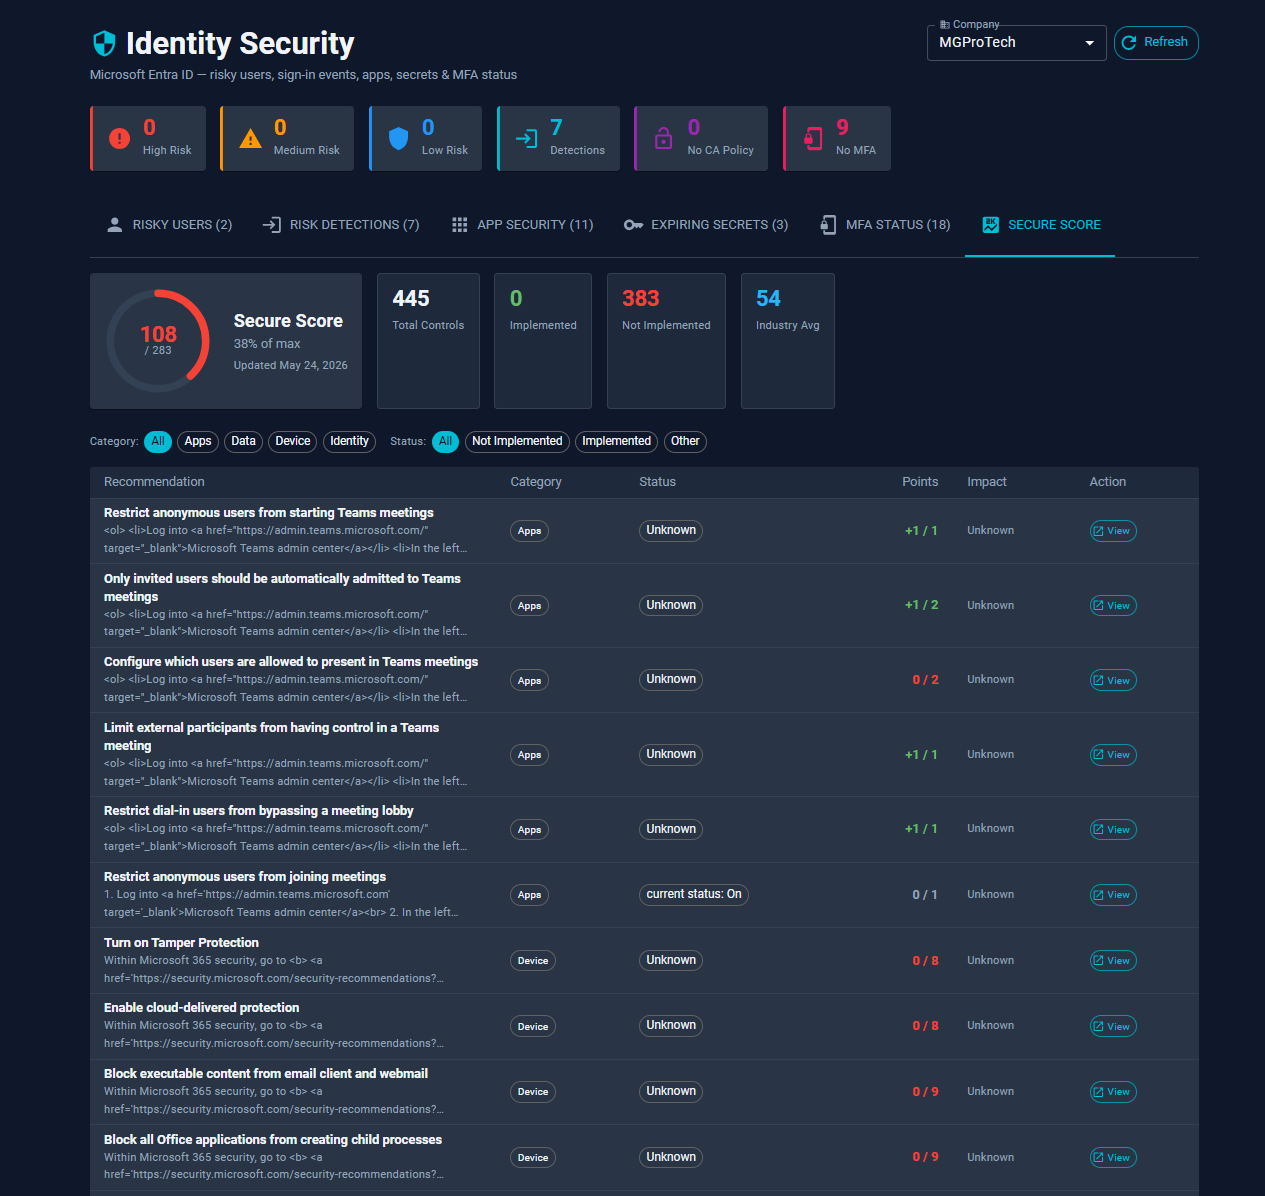
Identity Risk Assessment
Entra ID risk detection, MFA tracking, and 14 Azure AD security indicator checks — plus 16 on-premises Active Directory security checks executed via gMSA on domain controllers. No credential passing required.
- 🛡Weighted security score — 0–100 score with MITRE ATT&CK tags and remediation guidance per check
- 🔑MFA & privileged roles — Flags unconfigured MFA, >5 Global Admins, permanent role assignments, guest privilege
- 🚫Legacy auth & consent — Detects legacy protocols, hidden consent grants, unrestricted guest invitations
- 📊Inactivity & exposure — Users/devices inactive 90+ days, risky custom permissions, app registration risks
- 🔐Credentials — Password never expires, not required, >365 days old, unused admin accounts
- ⚡Kerberos — AS-REP roasting, Kerberoastable SPNs, unconstrained delegation, RC4 enabled
- 👑Privileges — >10 Domain Admins, guest account active, computer accounts in privileged groups
- 🏗Infrastructure — Domain functional level, SMBv1 enabled, inactive DCs, LDAP signing not enforced
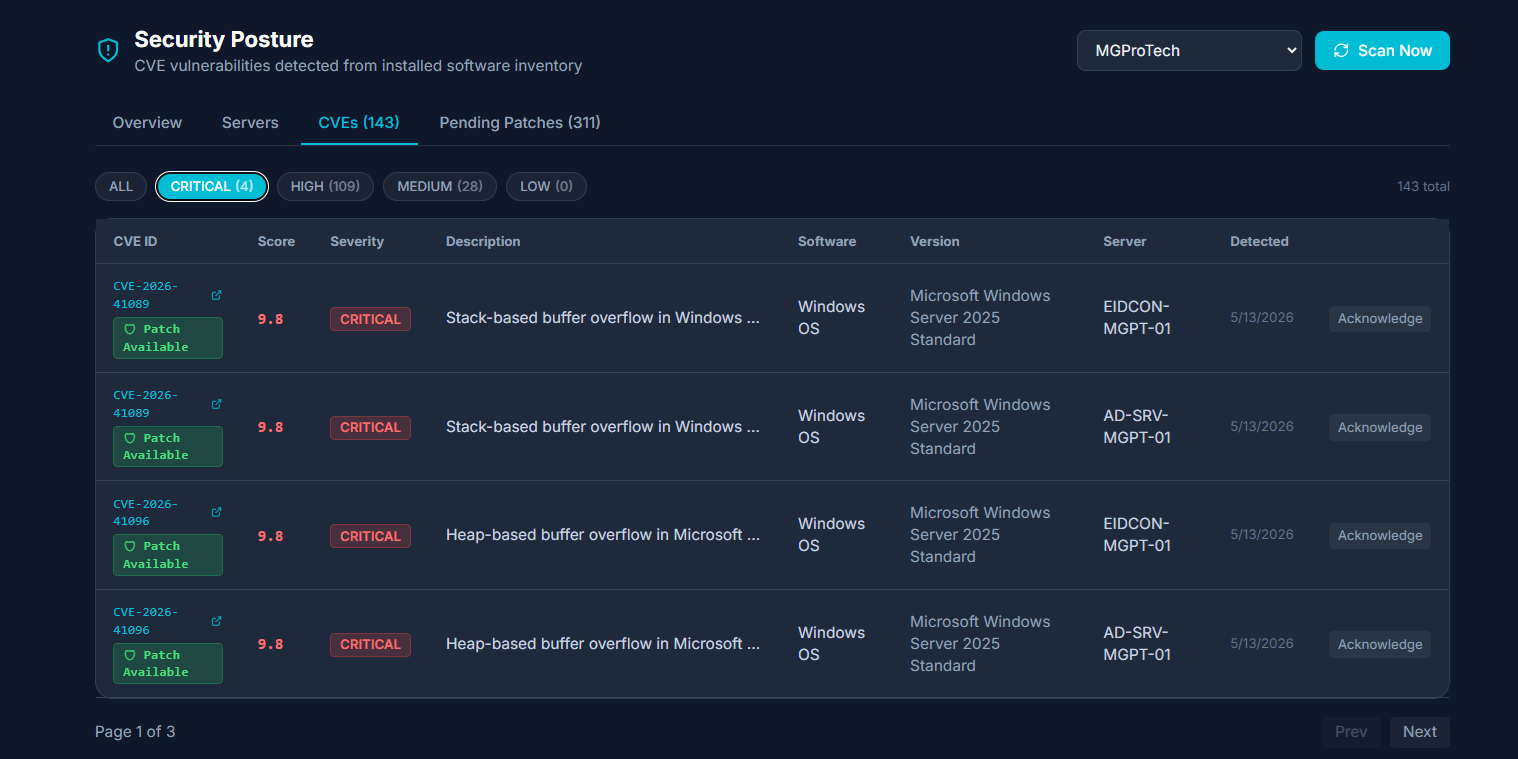
CVE Scanning & Security Posture
CVE risk assessment against installed software via NIST NVD API. Severity grading, patch status dashboard, and per-device compliance scoring for proactive vulnerability management.
- 🔎NIST NVD API — Real CVE data matched against agent-reported installed software
- 📊Per-device compliance score — Exposure count and unpatched critical CVE count per server
- 📅Vulnerability timeline — Track CVE exposure history per server over time
- 🤖AI Advisor — AI-generated prioritized remediation recommendations per company
- 📋Patch status dashboard — See what's patched, pending, or unaddressed across the fleet
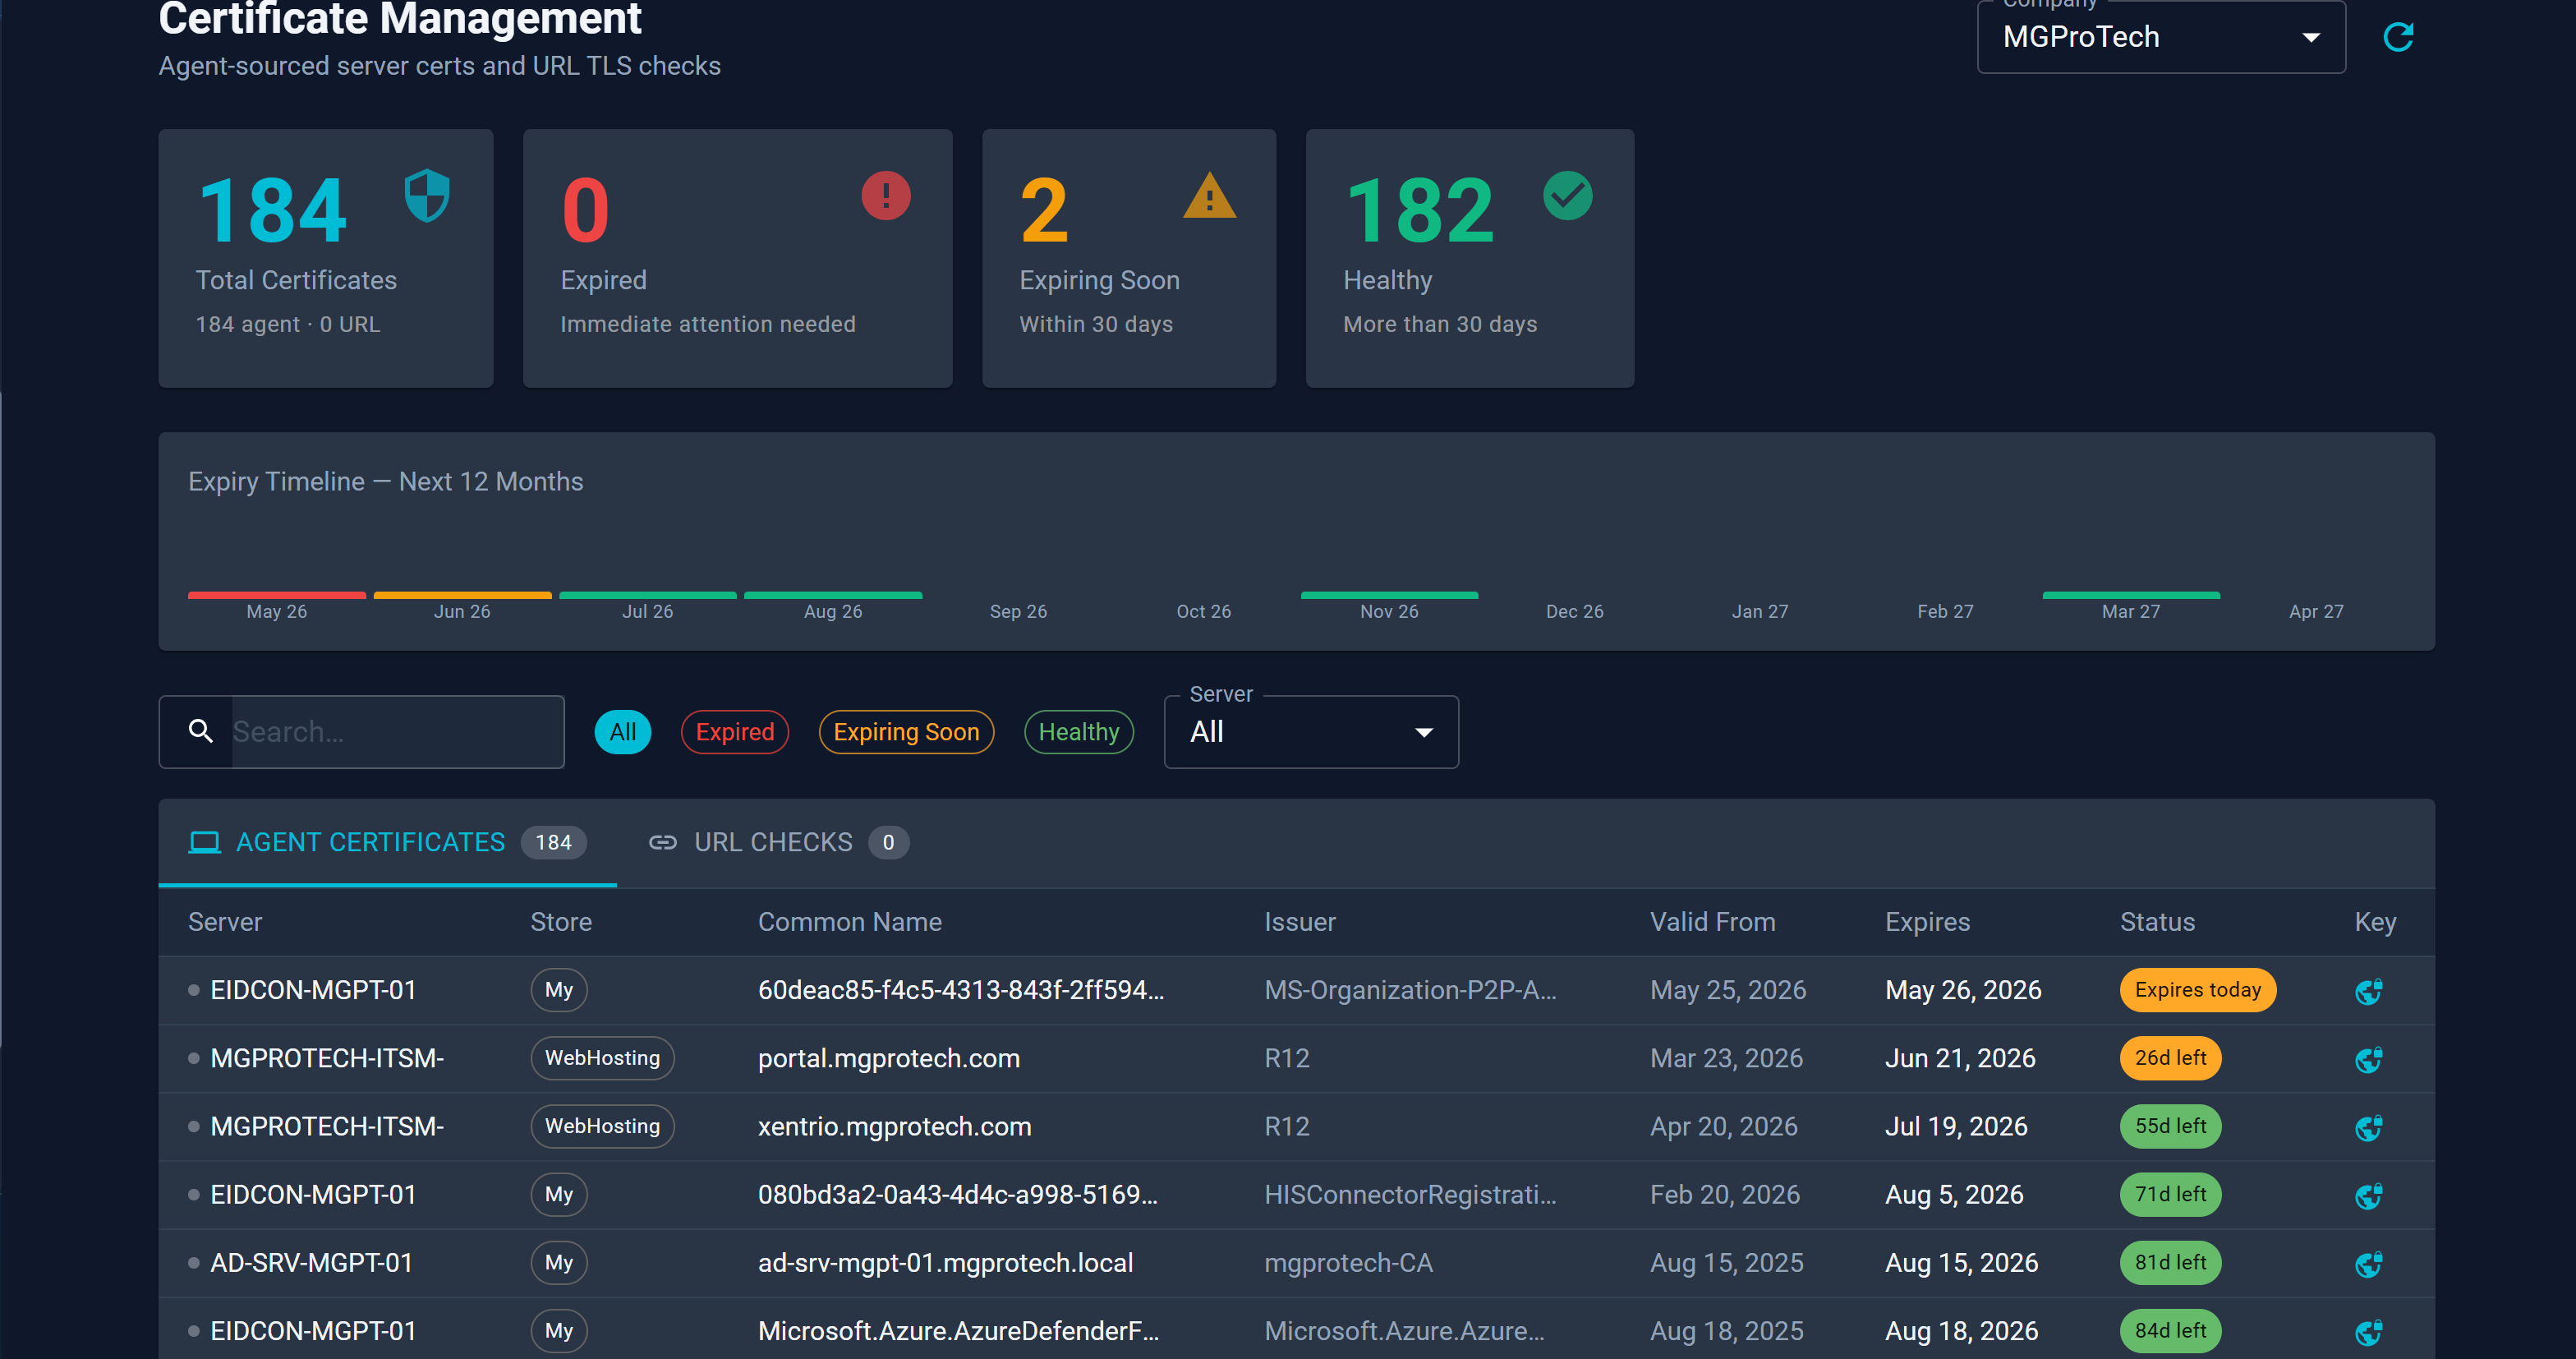
Certificate Lifecycle Management
Agent-collected and URL-checked certificate inventory with expiry tracking, NOC SSL/TLS warnings, and tabbed UI for managing certificates across your entire environment.
- ⏱Expiry tracking — Days-remaining countdown with configurable alert thresholds
- 📺NOC SSL/TLS warnings — Expiring certificates surface directly on the NOC dashboard
- 🔗Chain & subject tracking — Issuer, subject, SAN, and full chain details per certificate
- 🗂Tabbed inventory — Agent certs and URL certs in a unified tabbed environment view
- 🔔Alert rule integration — Alert rules can trigger on SSL expiry windows
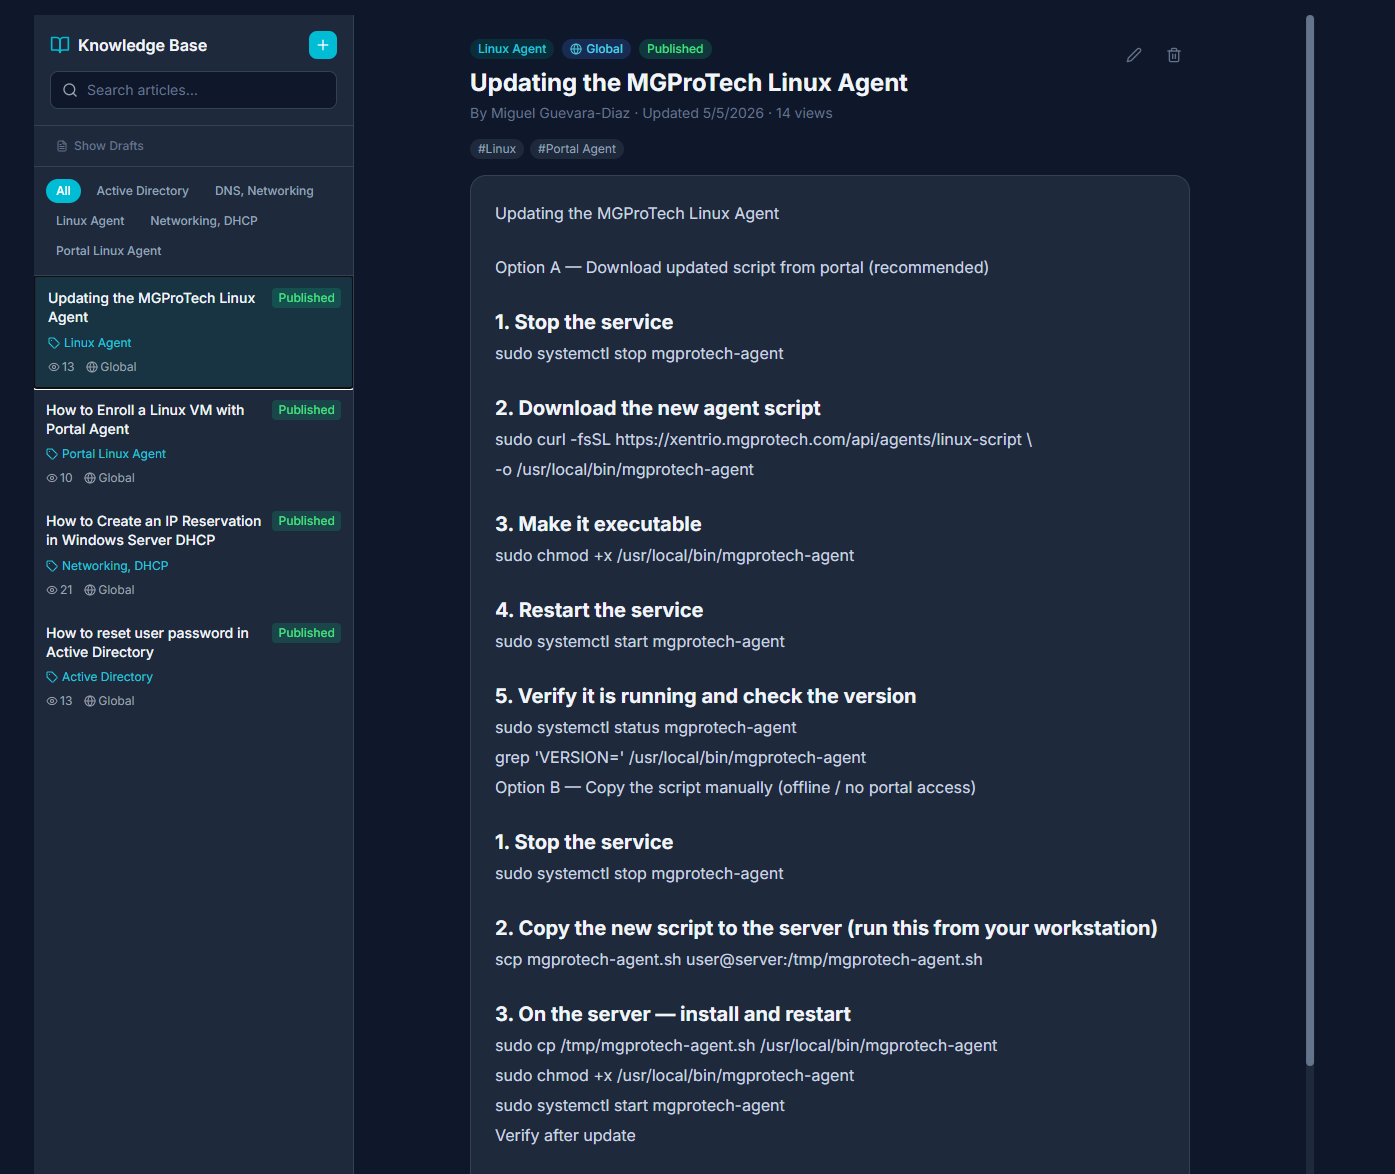
Knowledge Base
Full-text search, tag filtering, and role-based visibility including client access. Integrated with the Service Catalog so teams and end users can self-serve answers before submitting tickets.
- ✏Markdown editor — Rich article creation with formatting, code blocks, and images
- 🔍Full-text search — Instant search across all article titles and body content
- 🏷Tags & categories — Organize articles and filter by topic, team, or product area
- 🎫Ticket integration — Attach KB articles directly to ticket responses
- 🛒Service catalog link — Articles surface in the catalog so users self-serve before submitting tickets
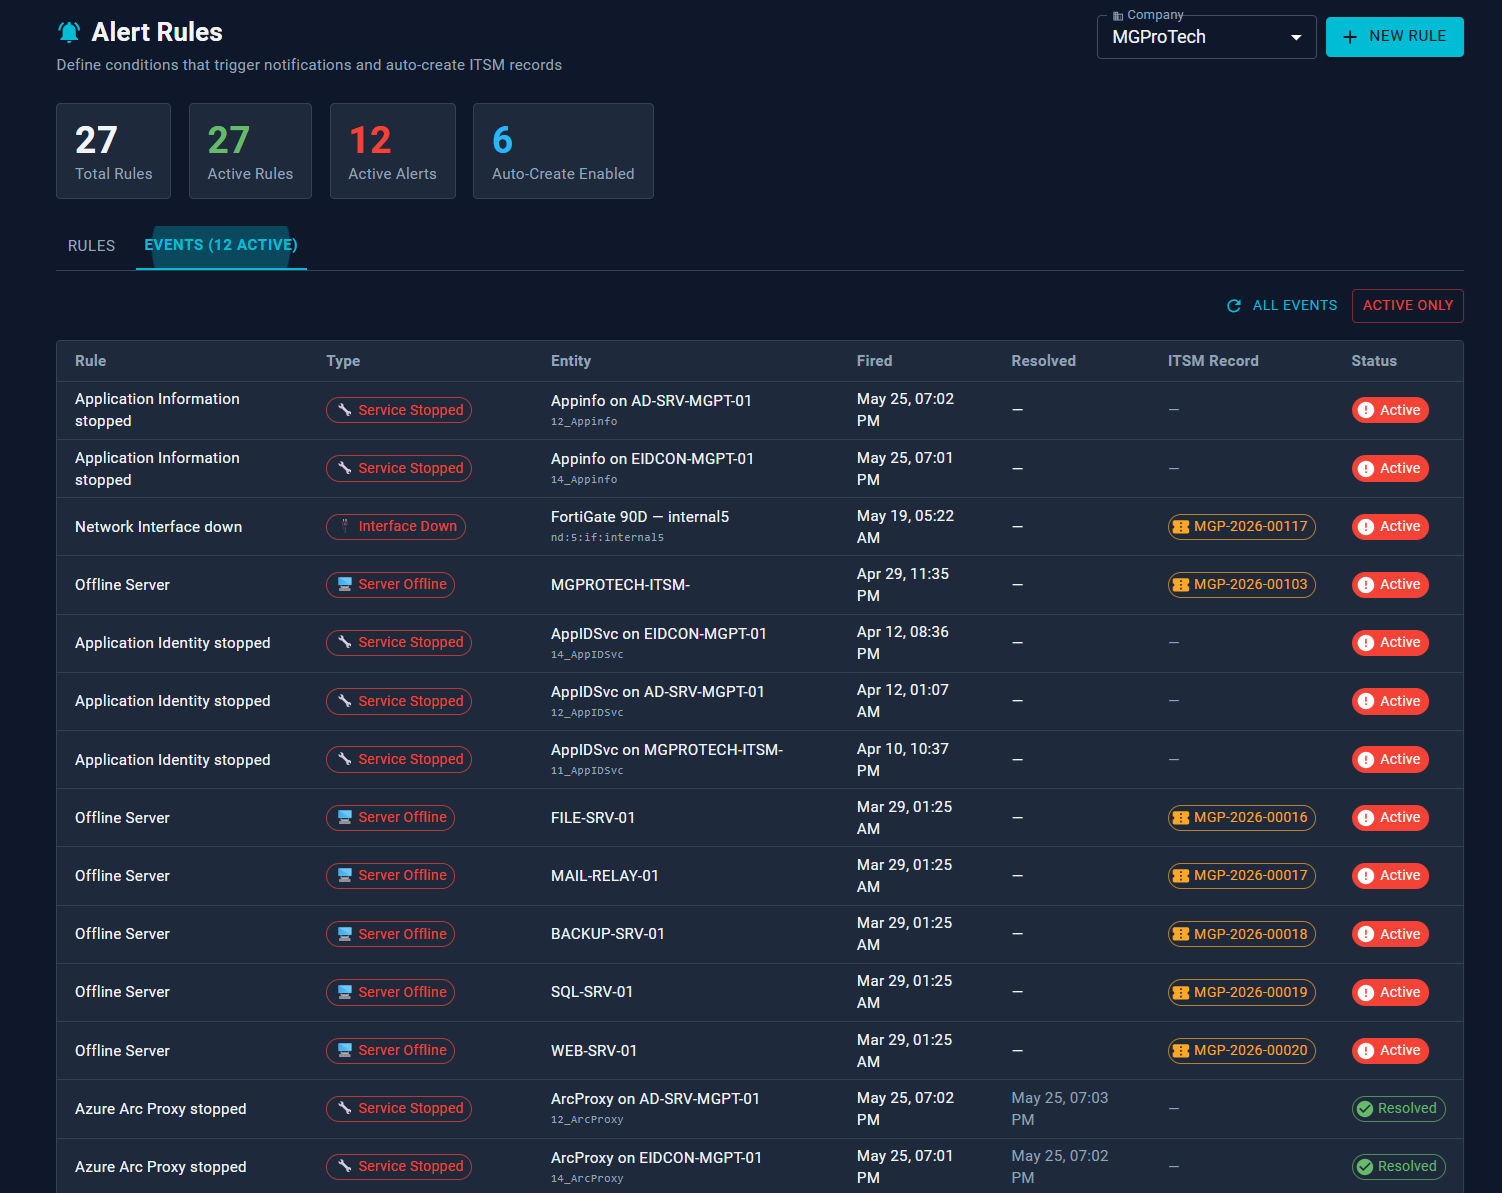
Alert Rules Engine
19 rule types across servers, network devices, network flow, and identity. Rules evaluate every 5 minutes with auto-resolve, Teams Adaptive Cards, email via Graph API, and auto-create Ticket or Incident on fire.
- ⏱Evaluates every 5 min — auto-resolves when condition clears, re-fires on recurrence
- 💬Teams notifications — Adaptive Card to configured channel on rule fire
- 📧Email via Graph API — per-company App Registration, no SMTP server required
- 🎫Auto-create Ticket or Incident — configurable per rule; fires automatically on alert
- 🎯Scoped rules — target a specific server, flow exporter, or SNMP interface
Network Flow Analytics
Collects NetFlow v5/v9, IPFIX, and sFlow from FortiGate firewalls via the on-site relay. Visualizes top talkers, protocol distribution, and traffic conversations across 1h–7d windows.
- 📊Overview tab — top source & destination IPs, protocol distribution pie, traffic timeline
- 💬Conversations tab — src→dst table with bytes, packets, port, and duration
- ⏱Time windows — 1h / 6h / 24h / 7d selectable per view
- 🔗Interface filtering — filter flows to a specific SNMP interface index
- 📅30-day retention — automatic background cleanup of old records
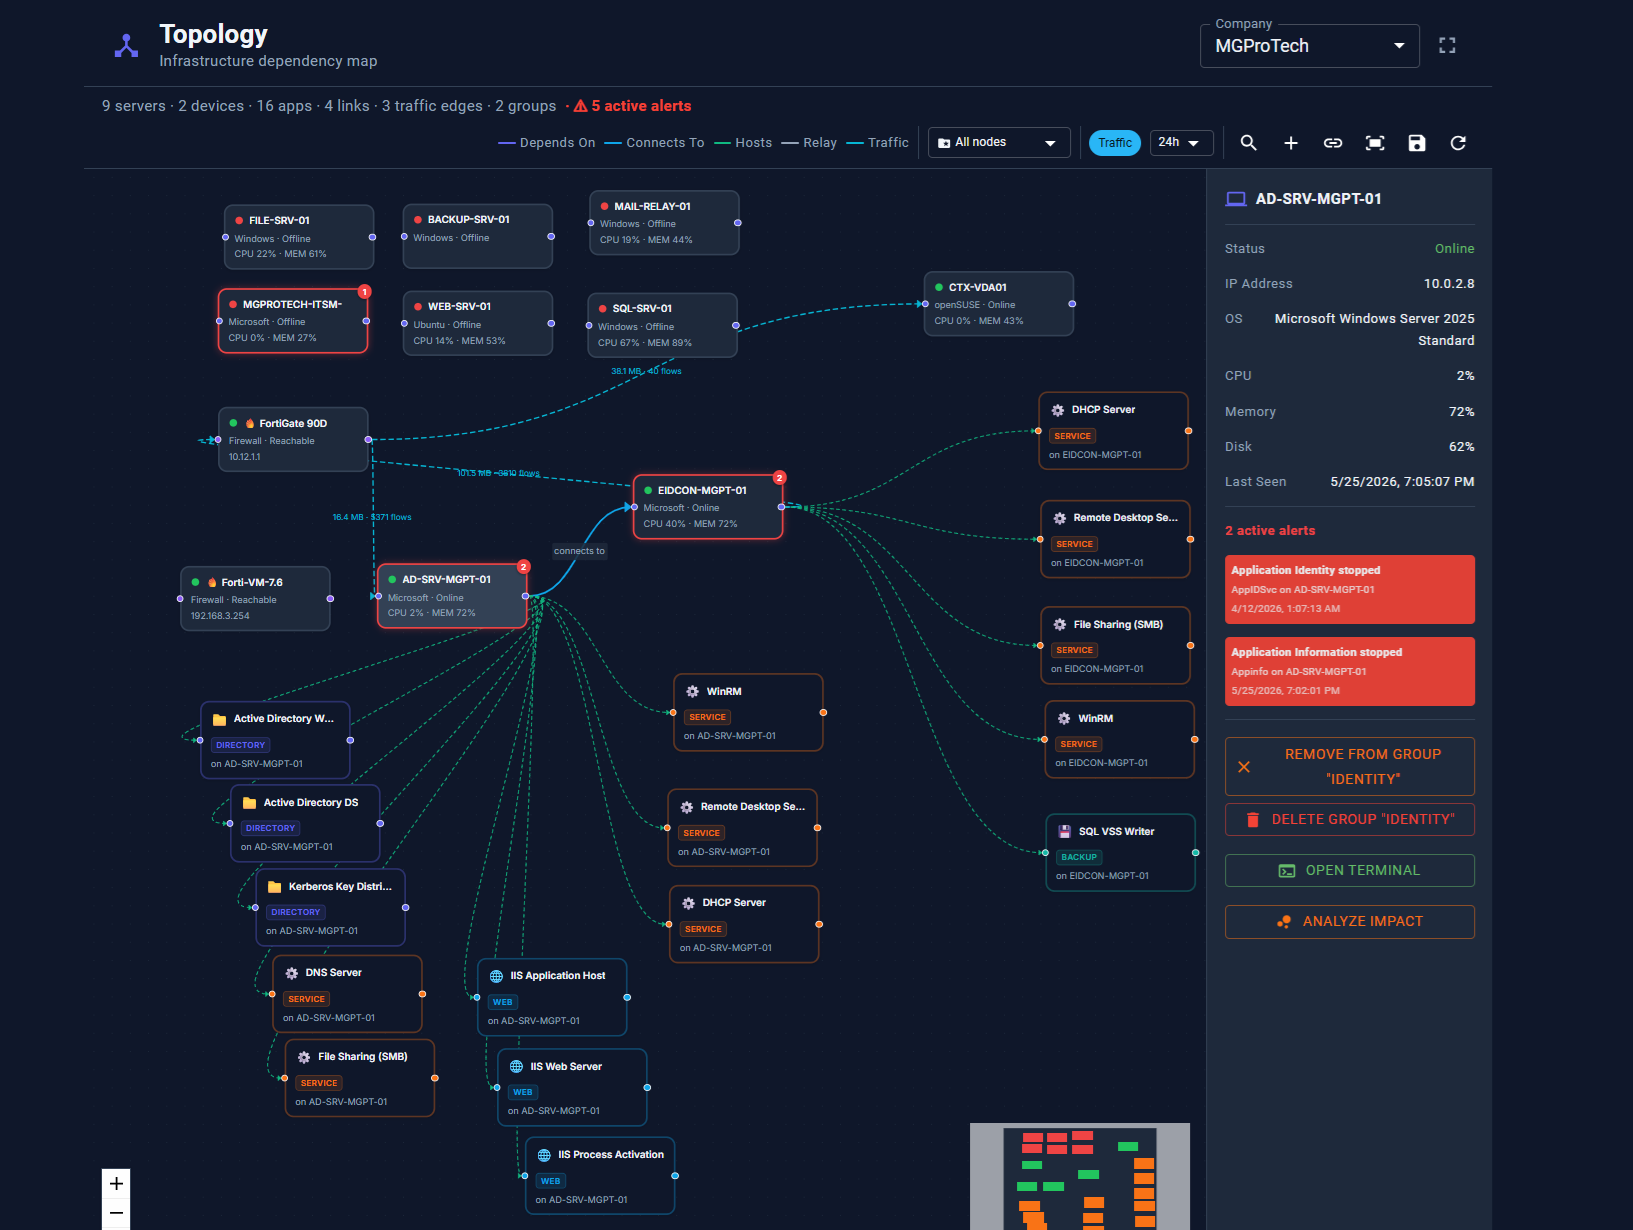
Topology Map
Interactive infrastructure map with live NetFlow traffic edges, blast-radius impact analysis, and 35+ auto-discovered services. Group and cluster nodes for large environments.
- 🔴Alert overlay — Red/yellow glow on nodes with active alerts; count badge per node
- 💥Blast-radius analysis — Click any node to highlight all downstream dependents across depth levels
- 🌊Live NetFlow edges — Real FortiGate traffic data, labeled with MB transferred and flow count
- 💻Web Terminal — Launch SSH directly from any server or firewall detail panel
- ⛶Fullscreen mode — CSS fullscreen that preserves all UI panel rendering
- 💾Persistent layout — Positions auto-saved 1s after drag; Save View commits all nodes atomically
 Live topology view
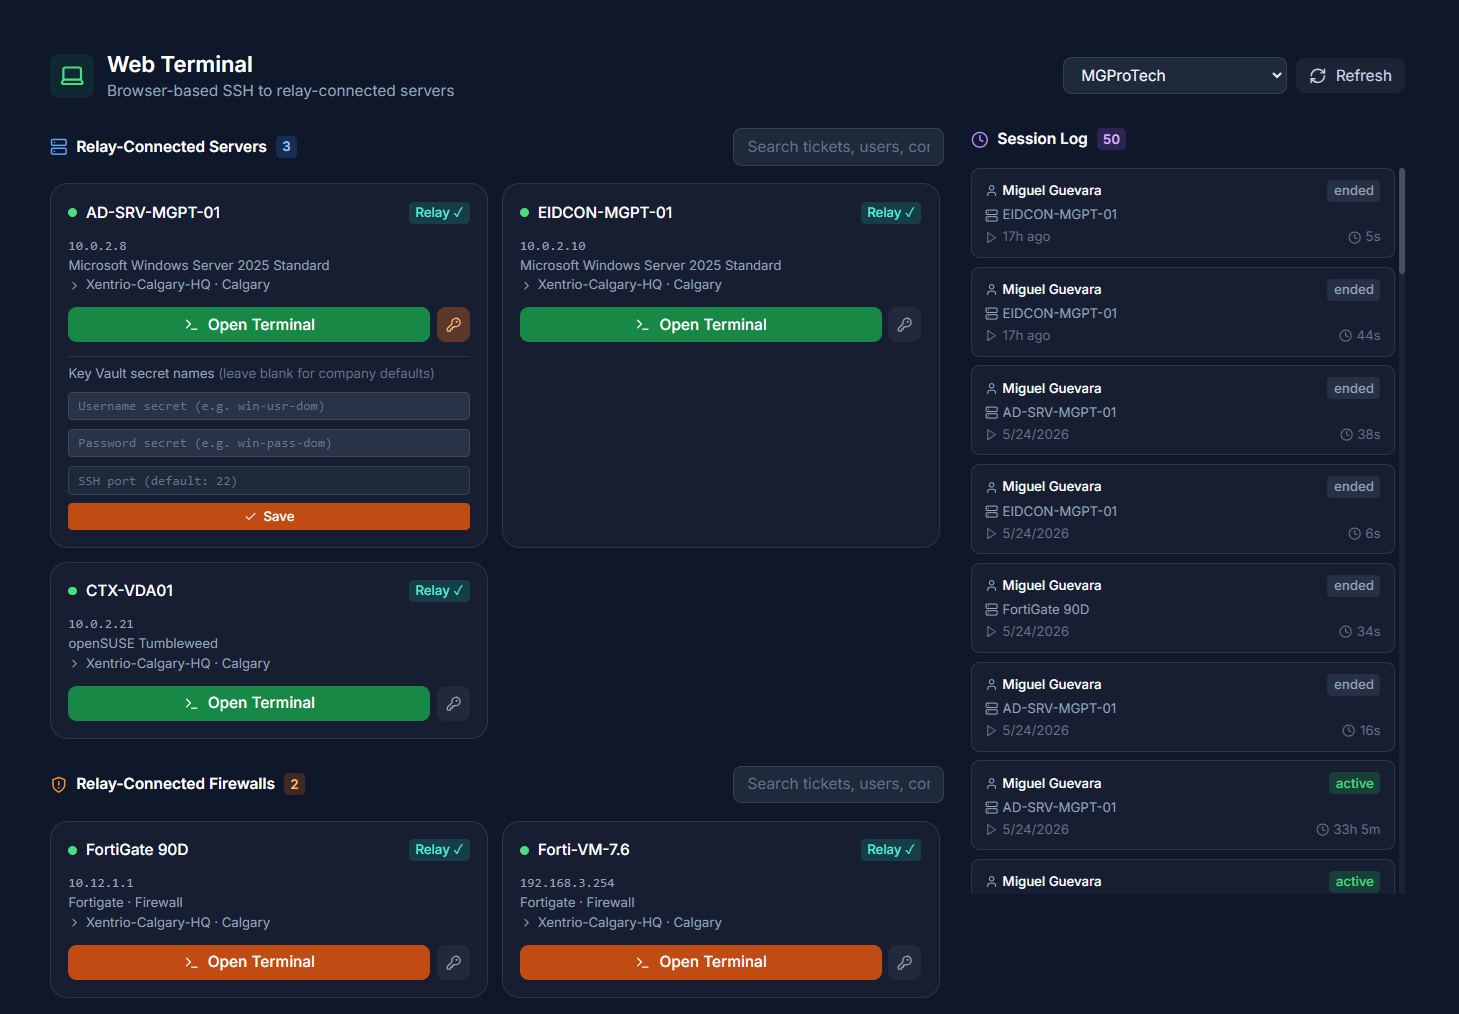
Browser SSH Terminal
Full xterm.js terminal tunneled through the on-site relay — no SSH ports exposed to the internet. Credentials sourced from Azure Key Vault with a full session audit log.
- 🔒Zero exposed ports — fully tunneled through relay, no inbound firewall rules needed
- 🗝️Azure Key Vault creds — company-wide default + per-server override, no passwords stored in DB
- 📋Session audit log — user, target, relay, start/end time, and client IP recorded
- ↔Auto-resize — terminal adapts live to window size via ResizeObserver
- 🌐Three entry points — dedicated page, Monitoring panel, or Topology map
- 👥Granular access — admins grant per user: all servers or a specific server list
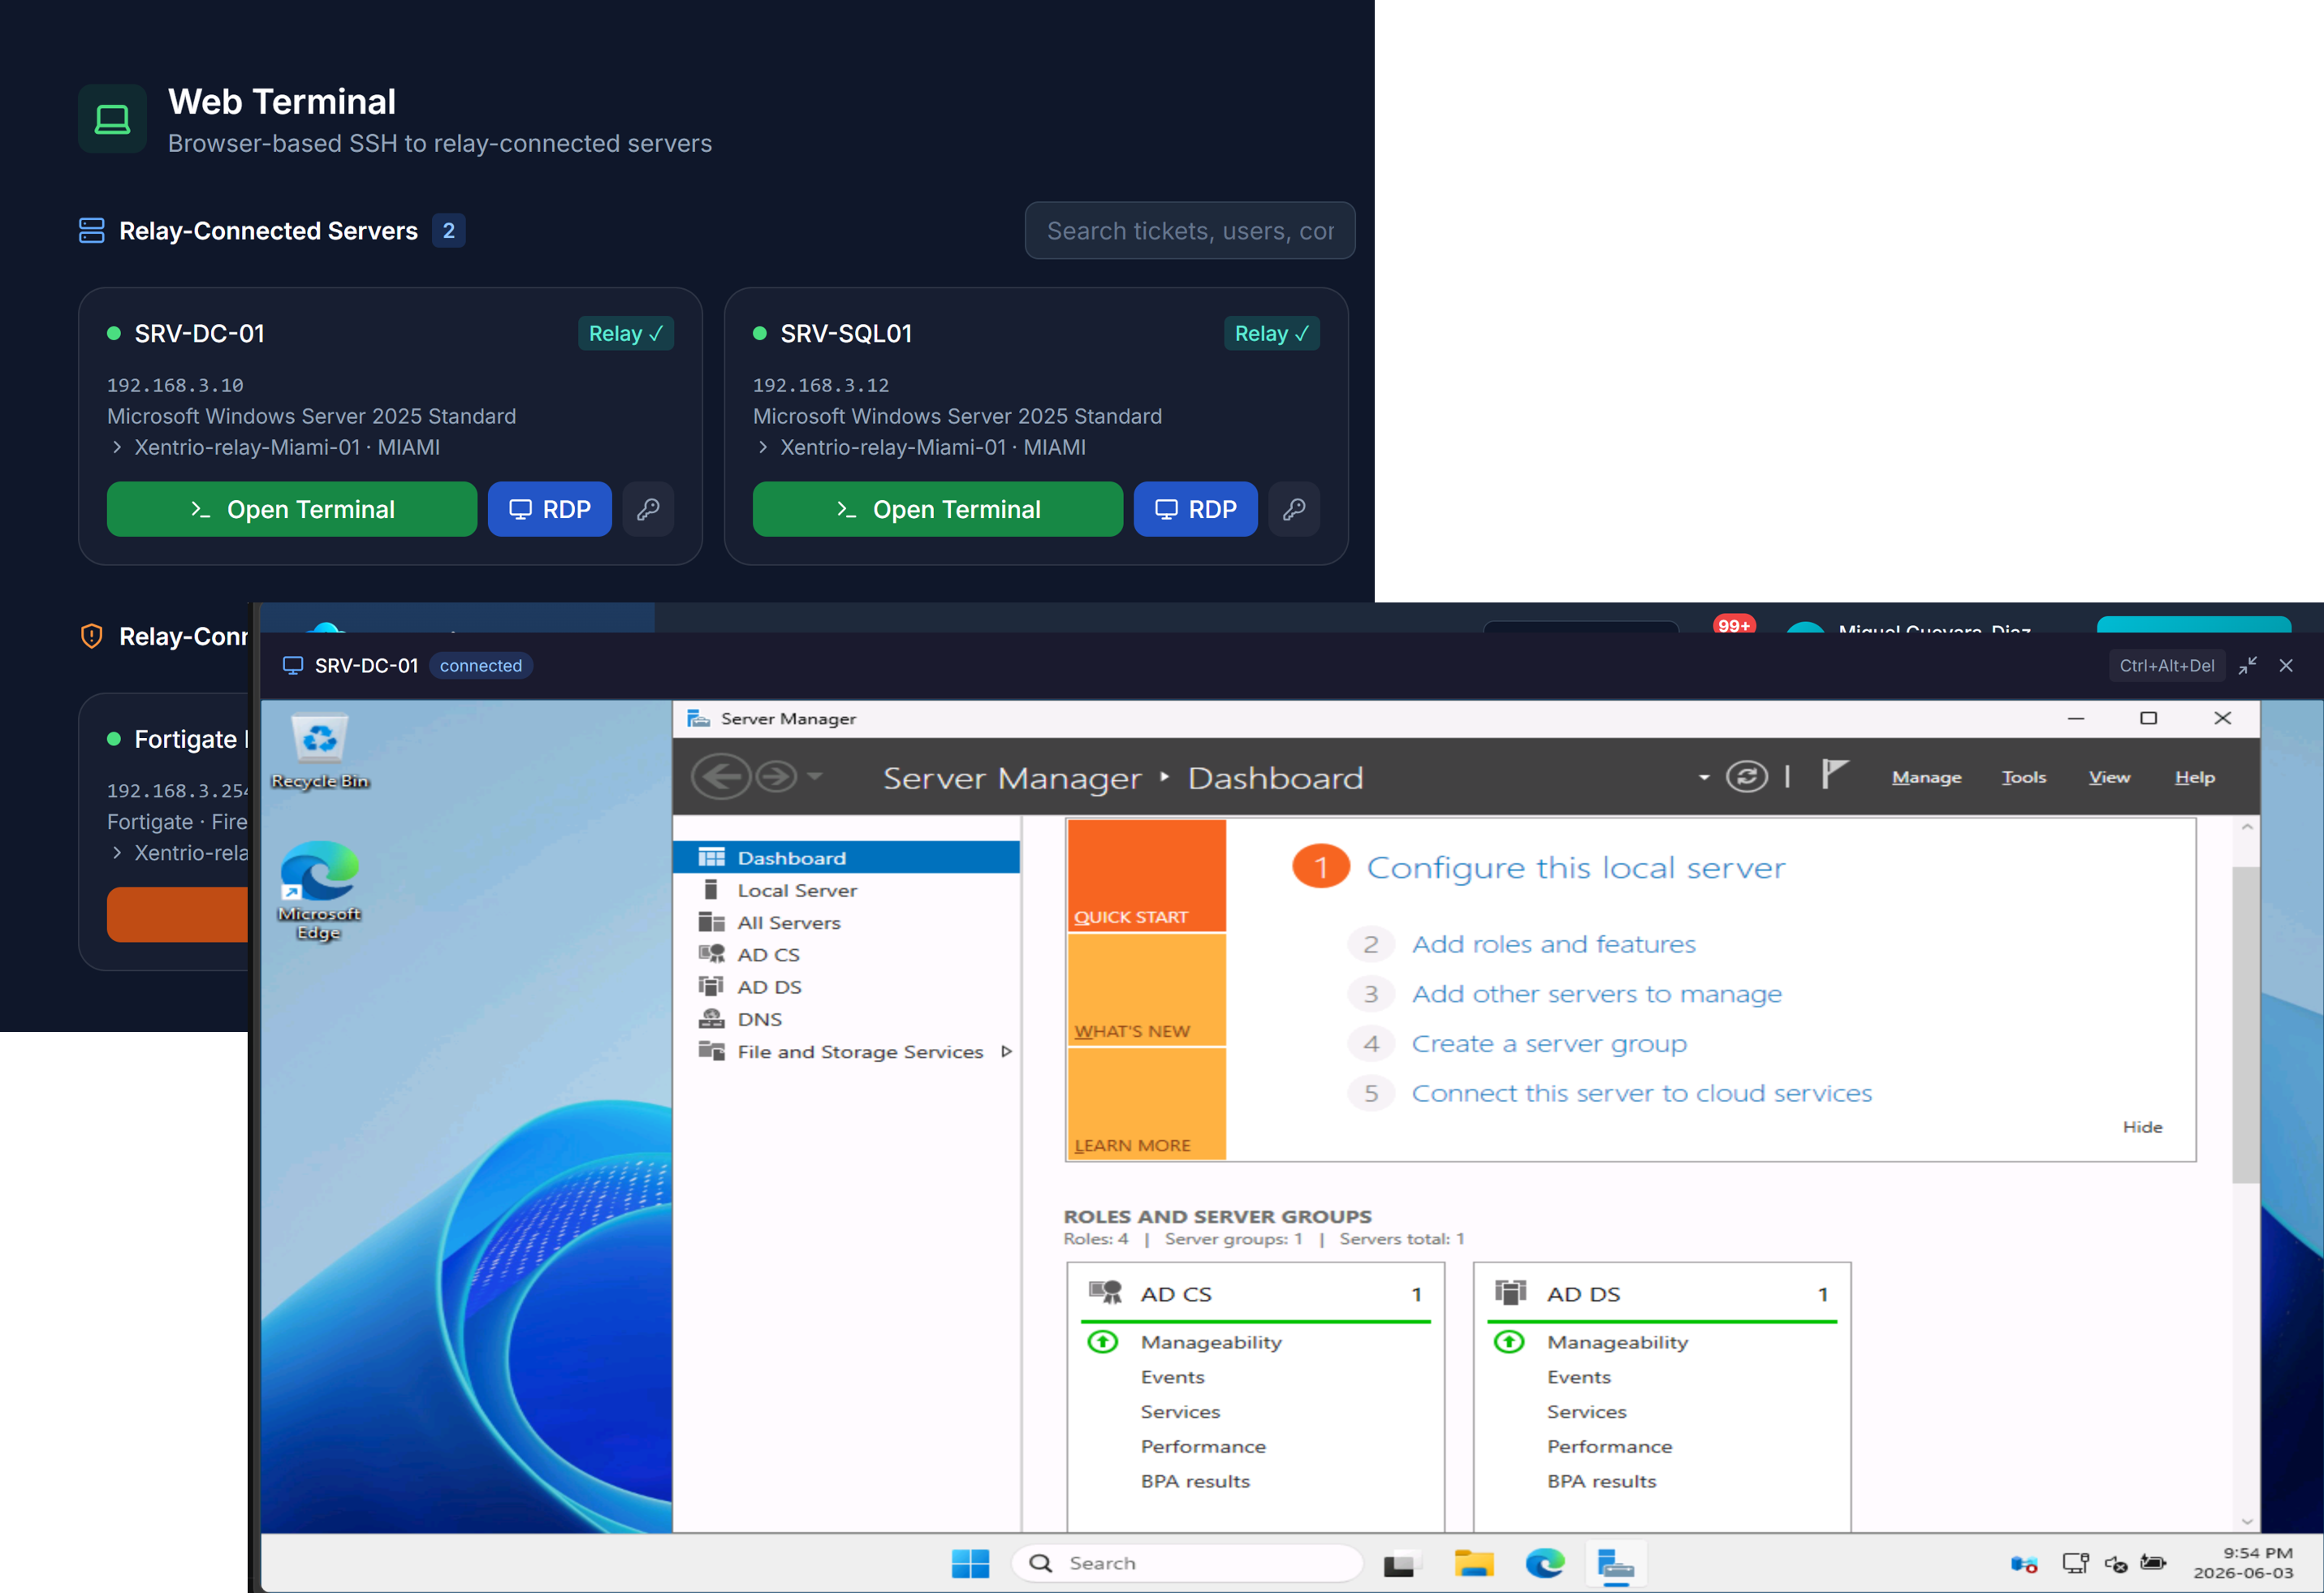
Browser Remote Desktop
Full GUI RDP session in the browser via IronRDP WebAssembly — no Apache Guacamole, no Linux containers. All traffic encrypted through the on-site relay TLS proxy. Only an outbound firewall rule to reach the Xentrio console is required.
- 🔒Zero exposed ports — RDP never reaches the internet; only outbound HTTPS to Xentrio required
- 🗝️Azure Key Vault creds — Same credential chain as Web Terminal; no passwords stored in DB
- 🦀IronRDP WASM — Rust-compiled WebAssembly; no guacd, no Linux containers, no Java
- 🖥Full-screen & clipboard — Resize, clipboard passthrough, and keyboard shortcuts supported
- 🔐NLA + CredSSP — HYBRID_EX handshake for full Server 2019 / 2022 compatibility
- 👥Granular access — Per-user grants managed by Admin / Manager / CompanyAdmin
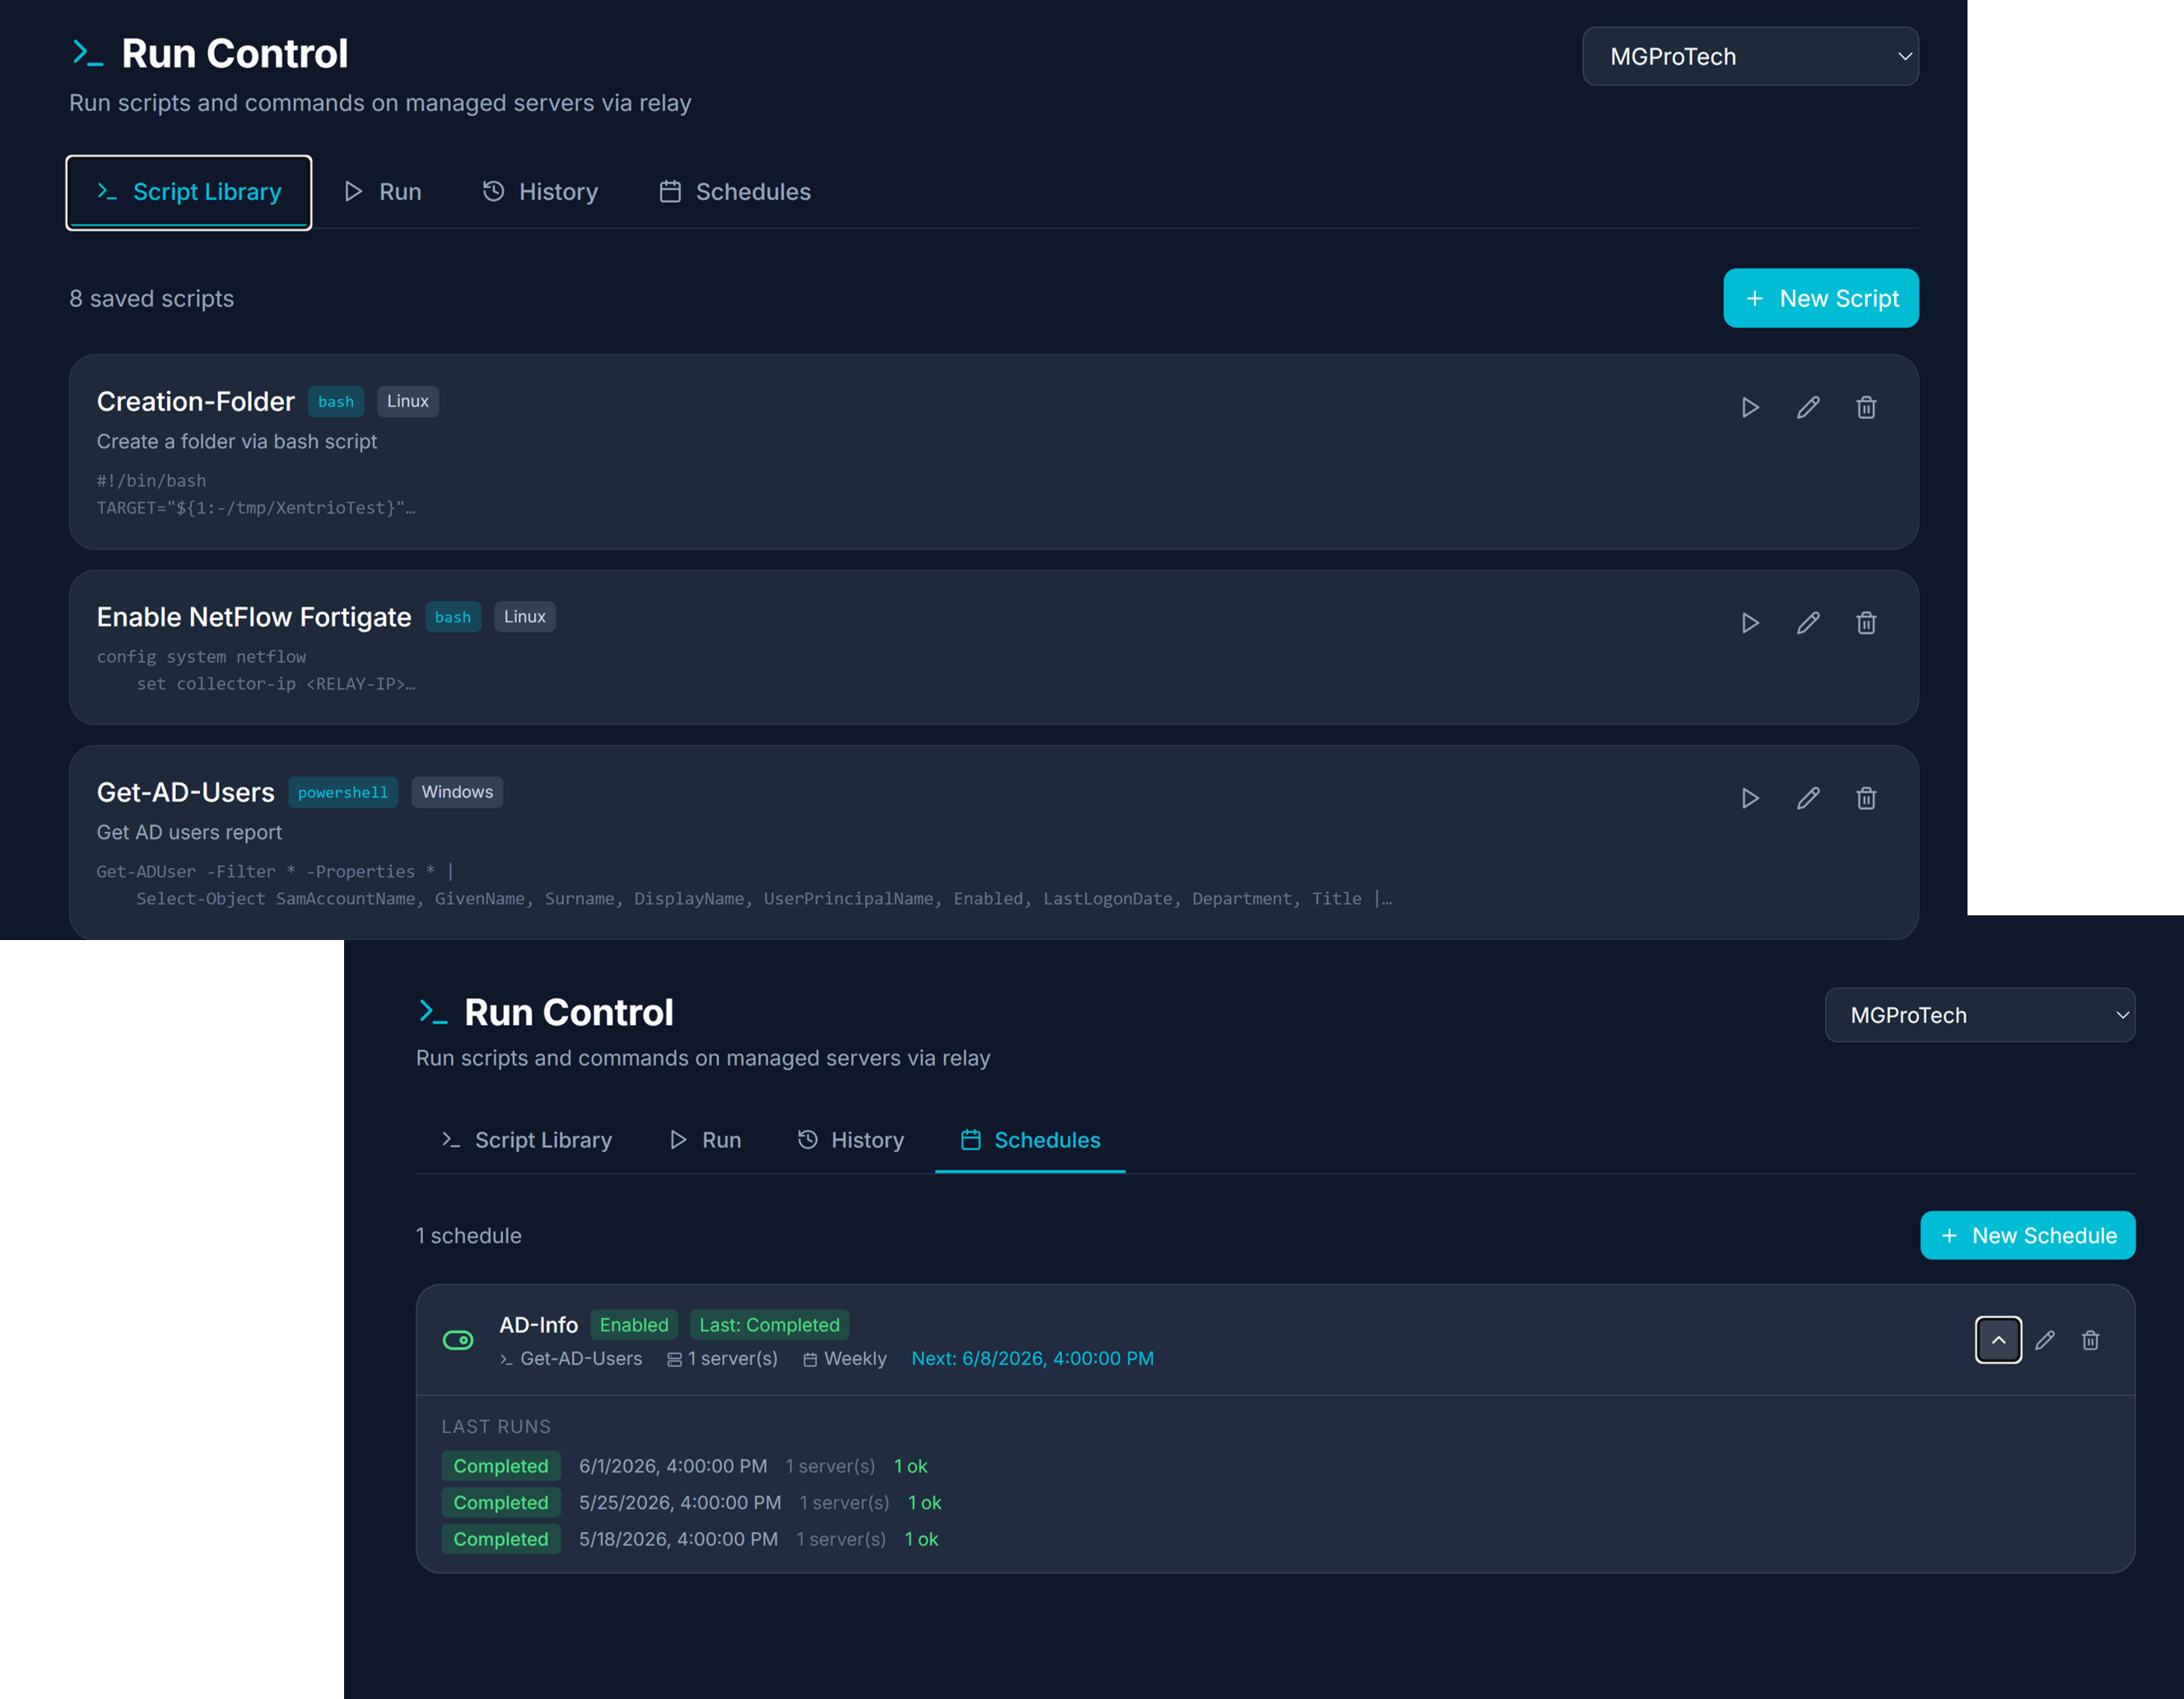
Run Control
PowerShell and Bash script library with scheduled execution, ad-hoc commands, real-time output streaming, and relay-routed software deployment — all without exposing ports.
- 📡Real-time streaming — Script output streams live back to the portal; exit code and per-server status tracked
- 📦Software deployment — Deploy packages via relay CDN cache (up to 10 GB); no re-download per target server
- 🕐Cron-style scheduling — Per-schedule run history with per-server success / failure counts
- 🪟Windows & Linux — PowerShell and Bash scripts; each tagged by OS type
- 🔒Relay-routed — All execution tunneled through on-site relay; no inbound firewall rules required